作者: 刘, 子豪

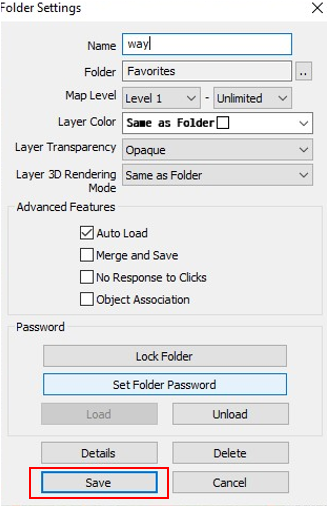
This article describes the object association feature of folders. Typically, this feature is applied to the telecommunications industry.

When telecommunications and power companies install utility poles (placemarks in QubiMap), they want the aerial cables (tracks in QubiMap) attached to them to move along with the poles. This greatly simplifies cable routing in design. To meet this need, QubiMap provides the folder object association feature, which allows tracks (cables) to move along with placemarks (poles).

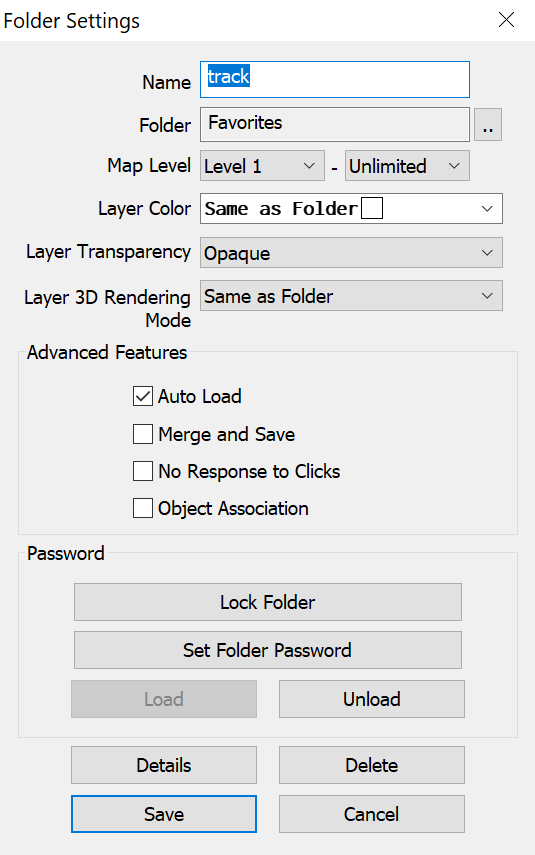
For example, there are 5 fiber optic cables attached to 100 utility poles. You can create 100 placemarks on the map in QubiMap to indicate the poles, and enable Editable State for these placemarks. Then, use the placemarks to generate 5 tracks, which indicates the 5 cables. Add the 100 placemarks and 5 tracks to the same folder, and select [Object Association] in the folder settings. Now, when you move any placemark (pole) on the map, the tracks (cables) also moves with the placemark.

In real scenarios, there may be tens of thousands of placemarks (utility poles) and hundreds or thousands of tracks (fiber optic cables), which are already distributed across different folders. You may find it difficult to put the related utility poles and fiber optic cables in the same folder. To solve this issue, you can use the parent folder and subfolders. Set [Object Association] for the parent folder and the required subfolders. For example, the A folder contains 1000 utility poles, the B folder contains 10 fiber optic cables that are related to A, and the C folder contains 20 fiber optic cables that are unrelated to A, and A, B, and C are all in the D folder. To associate A with B, you need to set [Object Association] for the D, A, and B folders. Now, when you move a utility pole in the A folder, the corresponding fiber optic cables in the B folder automatically moves with it, while the C folder remains unaffected.

QubiMap provides the map animation feature to dynamically and vividly demonstrate various scenarios on the map, which includes location jumping, track tour, text animation, time animation, object animation, voice playback, image animation, and so on. You can use map animations for project presentation, scenario simulation, and video export.

This article describes how to create a map animation and export it as a MP4 video.

1. Create a map animation

On the QubiMap main UI of your PC, choose [Map Objects] > [Map Animation].
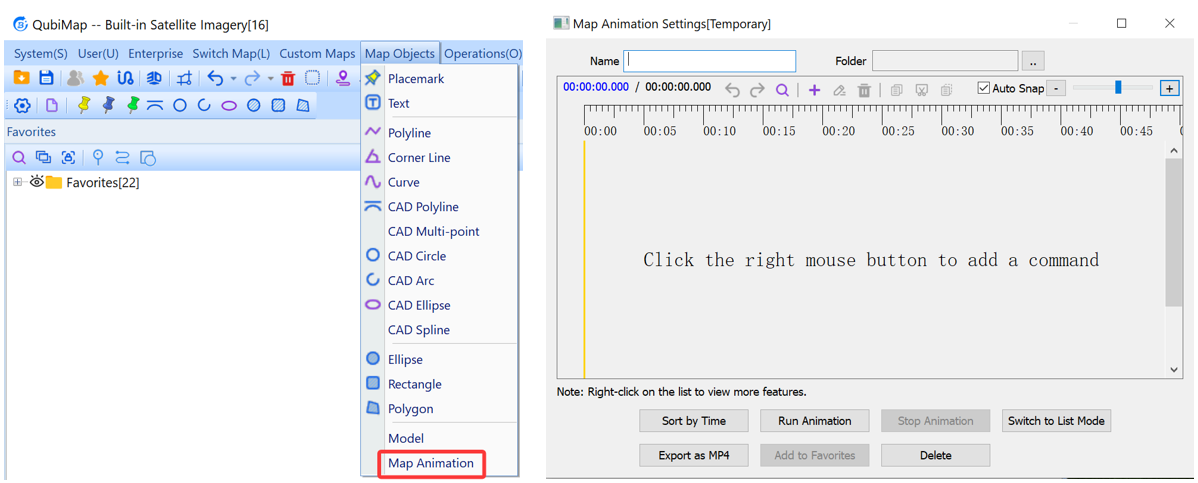
image-20260615141626872

You can right-click on the command list and select [Insert Command] to add an animation command. The options include [Location Jumping], [Track Playback], [Text Animation], [Show Time], [Object Animation], [Play Image], [Play Audio], [Play Video], [Wait Command], [Call Sub-Animation], [Switch Map], and [Switch Object Display Status]. You can add various commands as needed to generate an animation.

* Note: To save more than 10 animation commands, you need to purchase a VIP plan. *
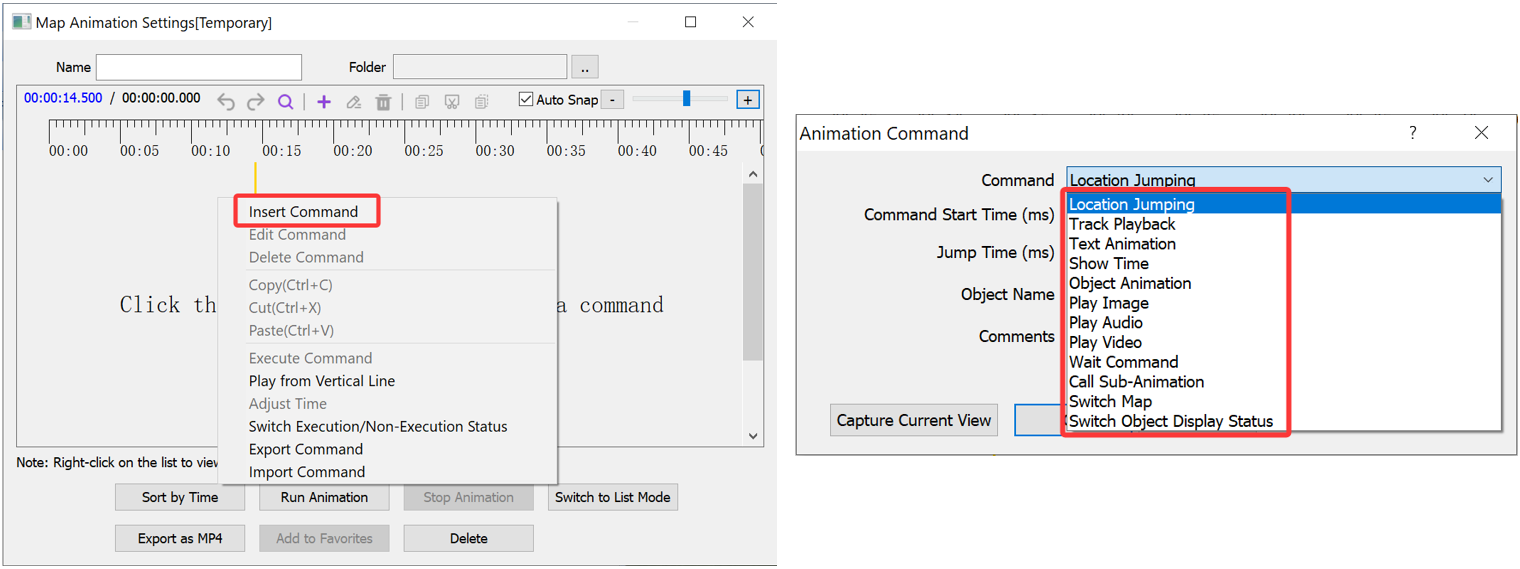
image-20260615142005868

① Location Jumping

Select [Location Jumping] from the command drop-down list. Set the parameters as needed.

Command Start Time (ms): The start time to execute this command. To start from the beginning, set it to 0. You can also set it to a time value after another animation command ends.

Jump Time (ms): The duration of the jump.

Object Name: You can click the img button next to [Object Name] to select an existing placemark, track, or shape as the jump destination. You can also click the img button to enter the latitude, longitude, altitude, and viewpoint distance as needed. If you want to use the current view’s location as the jump destination, click the [Capture Current View] button.
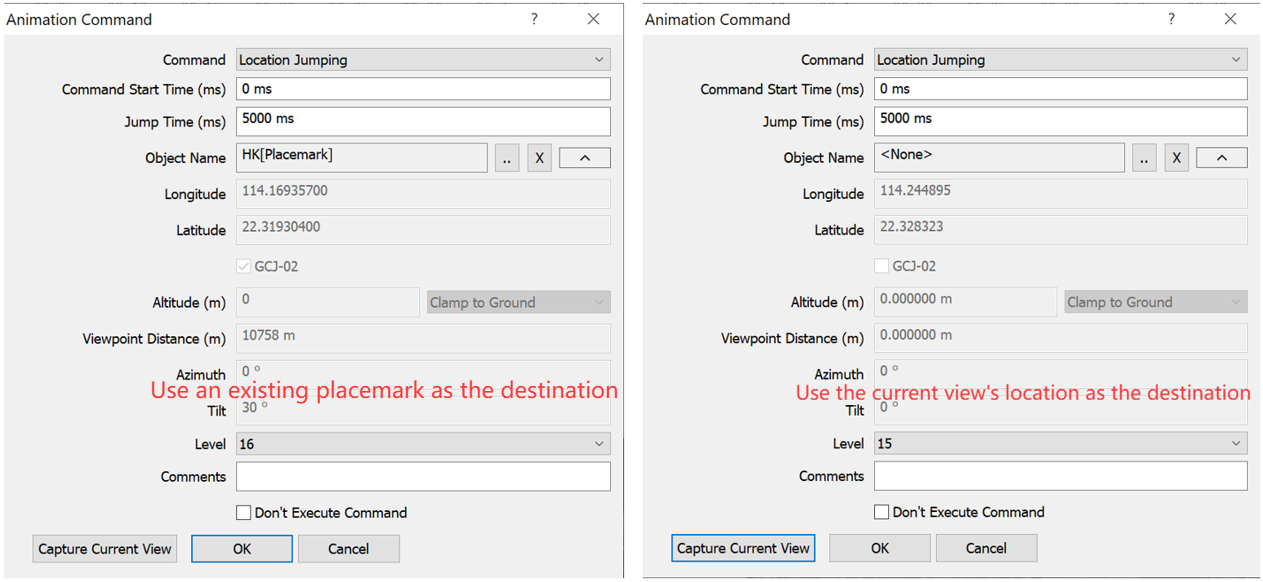
image-20260622113456501

Comments: You can add a description to this animation command.

Don’t Execute Command: Check this box to prevent this command from running when you run the map animation.

After you set the parameters, click [OK]. In the [Map Animation Settings] dialog box, click [Add to Favorites] to add the animation to your favorites.
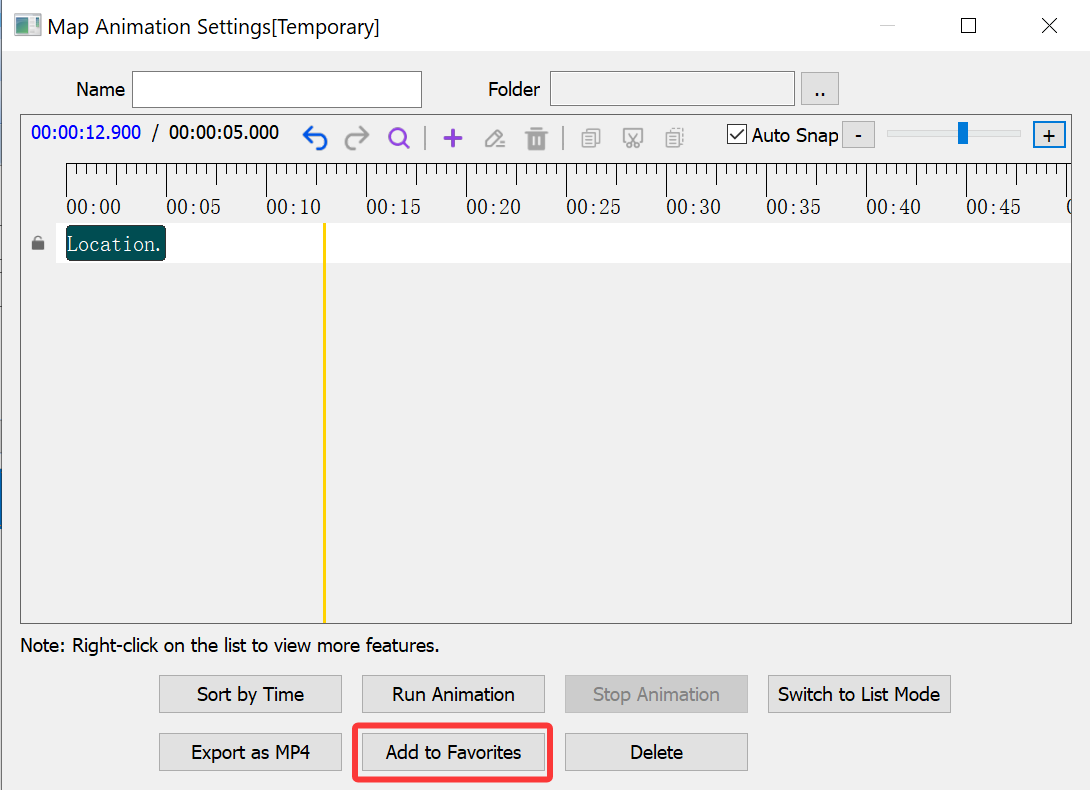
image-20260615153326683

② Track Playback

Select [Track Playback] from the command drop-down list. Set the parameters as needed. You can click the img button next to [Track Name] to select a single track or a folder that contains multiple tracks.
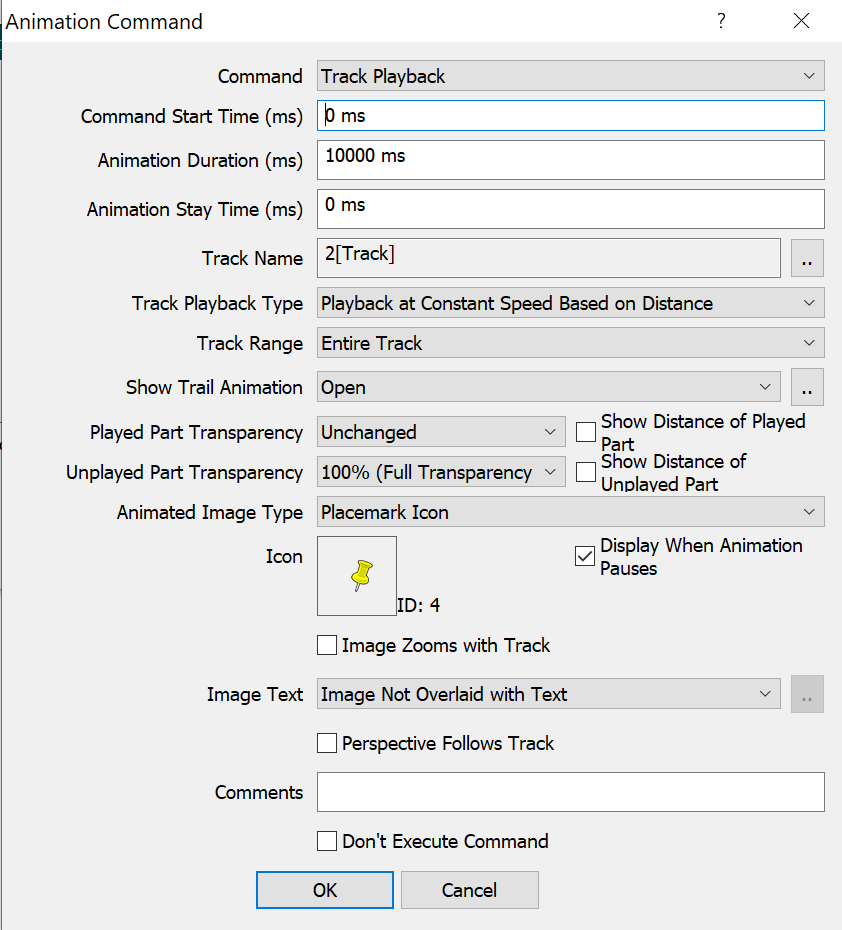
image-20260615153502174

Command Start Time (ms): The start time to execute this command. To start from the beginning, set it to 0. You can also set it to a time value after another animation command ends.

Animation Duration (ms): The time period required for the animation playback.

Animation Stay Time (ms): The stay period after the animation playback is completed.

Track Playback Type: You can select one of the following values as needed:

A. Playback at Constant Speed Based on Distance: Play the track animation at a constant speed based on the track distance;

B. Instant Playback with Same Interval of Track Time: Play the track animation immediately with the same interval based on the track time range;

C. Scheduled Playback with Same Interval of Track Time: Play the track animation immediately with the same interval based on the specified track time range;

Note: If you need to set a start time and end time (time range), you must first go to [Track Settings] → [Advanced] → [Edit Track Points] to add time parameters to the track points. Otherwise, the [Track Playback] command cannot be executed. The starting point of the track must have a time value, and at least two track points need to have time values. Additionally, the time values of track points must be in ascending order. If the time value of a track point is no later than the previous point, that time value is skipped. If intermediate points lack time values, the system distributes the time evenly based on the distance.

Track Range: Set the range of the track for playback. You can specify the entire track, or select some part of the track by distance or time.

Show Trail Animation: If you enable this feature, the trail is displayed in the animation image during track playback. You can click the image-20240110171422511 alt=”image-20240110171422511″ style=”zoom:80%; The “/> button to set the trail display style.

Played Part Transparency: Set the transparency for the played part of the track. You can select a value from 0% (opaque) to 100% (fully transparent).

Unplayed Part Transparency: Set the transparency for the unplayed part of the track. You can select a value from 0% (opaque) to 100% (fully transparent).

Animation Image Type: You select a placemark icon or image to move on the track during the playback.

Image Text: You can select one of the following values as needed:

A. Image Not Overlaid with Text: No text is displayed on the image (icon);

B. Image Not Overlaid with Track Name: The track name is displayed on the image (icon);

C. Image Overlaid with Custom Text: Specify custom text to be displayed on the image (icon). You can also set the text position.

Comments: You can add a description to this animation command.

After you set the parameters, click [OK]. In the [Map Animation Settings] dialog box, click [Add to Favorites] to add the animation to your favorites.

③ Text Animation

Select [Text Animation] from the command drop-down list. Set the parameters as needed.
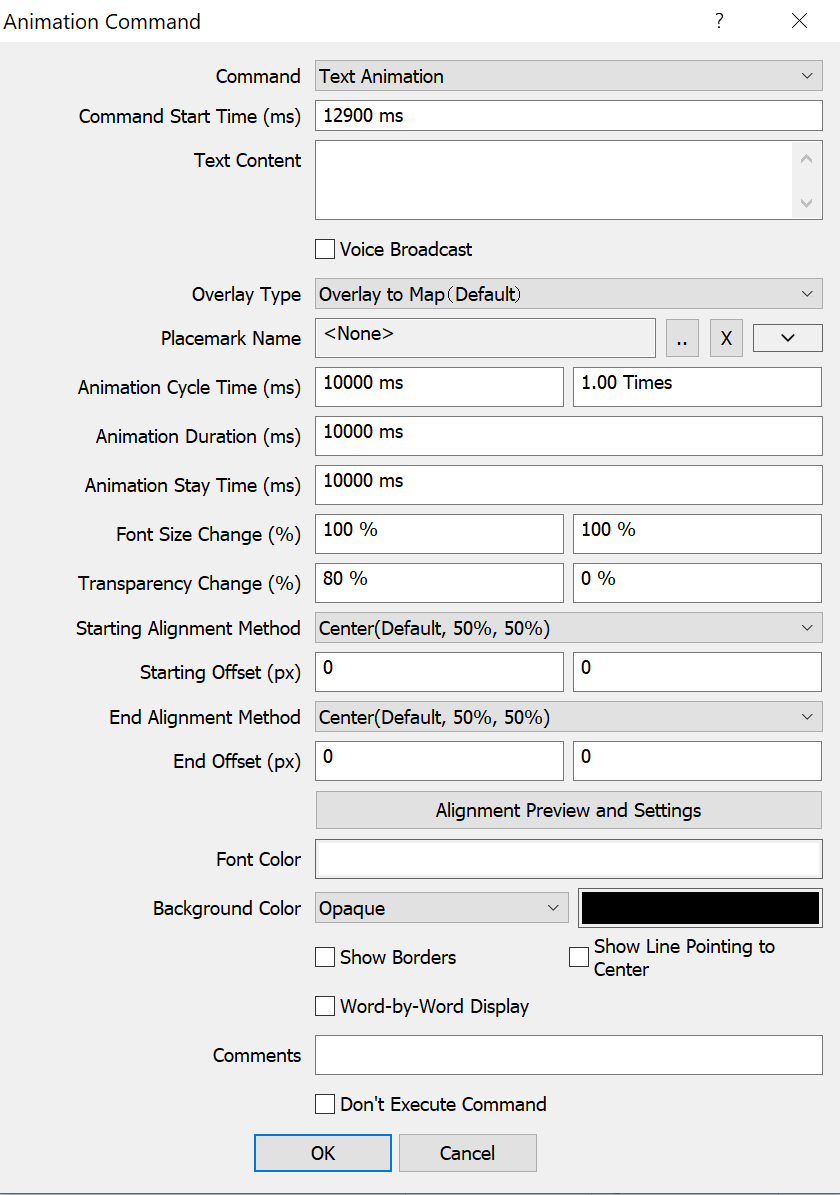
image-20260615153848400

Text Content: Multi-line text is supported. You can use the Enter key to start a new line. To change the text color, add <#x> before the text, where x ranges from 0 to 8. 0 represents the default color that is specified by using the Font Color parameter, while 1–8 corresponds to black, white, red, green, blue, yellow, cyan, and magenta, respectively. For example, if the text content is “abc<#1>de<#3>fg<#0>kk”, “abc” and “kk” appear in the default color, “de” appears in black, and “fg” appears in red. Text animations also support voice broadcast, with dozens of different announcer voices available.

Overlay Type: You can select either of the following values as needed:

A. Overlay to Map (Default): Overlay the text to the specified placemark or Lat-Long point on the map.

You can click the img icon to select a placemark for overlay, as shown in the following figure:
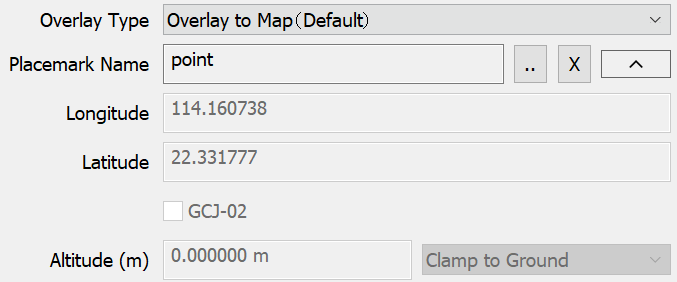
image-20260615154143066

You can also click the img icon to select a placemark for overlay, as shown in the following figure:
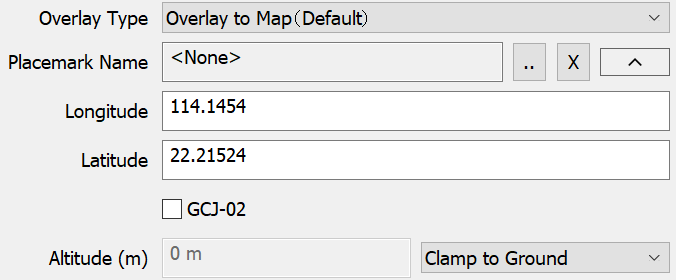
image-20260615154331372

B. Overlay to Screen: Demonstrate the text directly on the screen.

Alignment: If you set the overlay type to [Overlay to Screen], this value is relative to the screen. If you set the overlay type to [Overlay to Map], this value is relative to the specified placemark or Lat-Long point.

Alignment Preview and Settings: You can view and set the text position on the [Text Animation Position Settings] page.

Set other parameters such as the animation time, font size, transparency, and font color as needed.

Then, click [OK]. In the [Map Animation Settings] dialog box, click [Add to Favorites] to add the animation to your favorites.

④ Show Time

This command is used to show the time information on the map as an animation. Select [Show Time] from the command drop-down list. Set the parameters as needed.
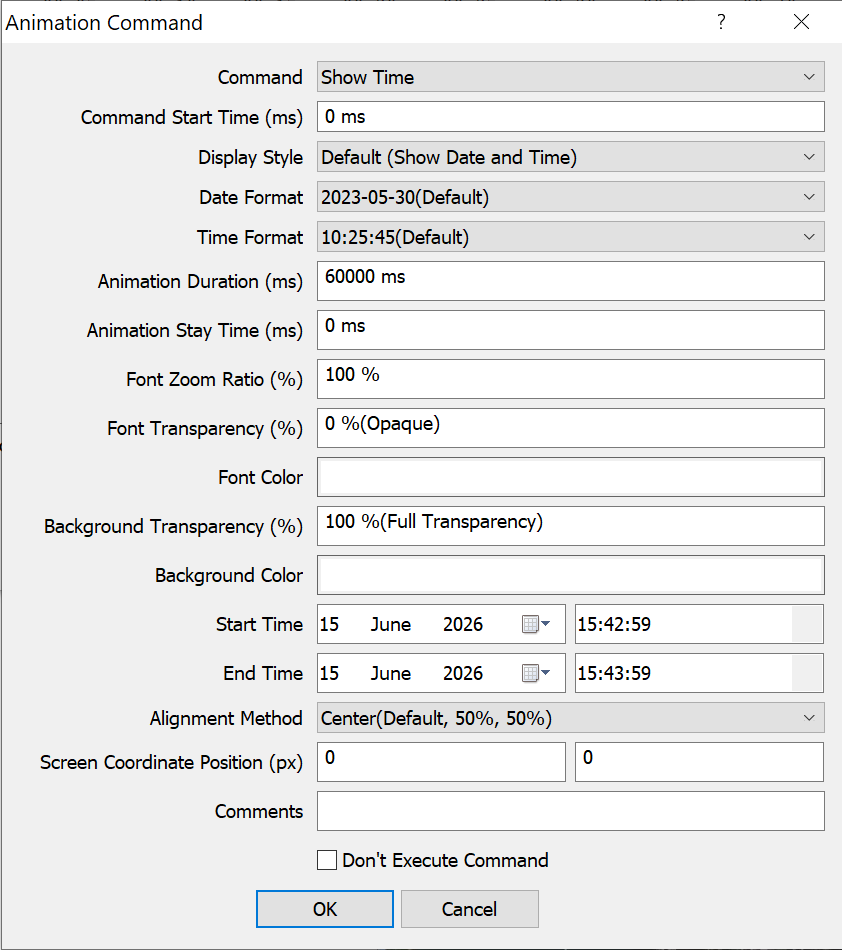
image-20260615154440695

Then, click [OK]. In the [Map Animation Settings] dialog box, click [Add to Favorites] to add the animation to your favorites.

⑤ Object Animation

This command is used to show map objects including placemarks, tracks, and shapes on the map as an animation. Select [Object Animation] from the command drop-down list. Set the parameters as needed. You can click the img button next to [Object Name] to select a single object or a folder that contains multiple objects.
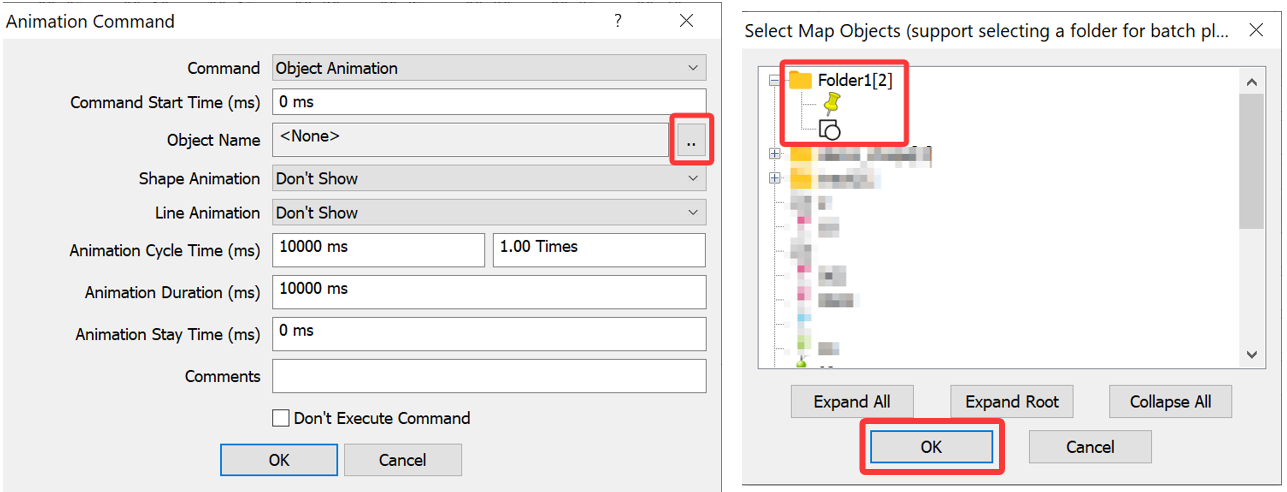
image-20260615160245512

Shape Animation:

A. Don’t Show: Do not show shape objects while executing this command.

B. Normal Display: Show shape objects while executing this command.

C. Shine: Shape objects flash on the map.

D. Color Gradient: Shapes gradually change from the opposite color to the set color. For example, if the shape color is set to black, the color will gradually change from white to black during the animation playback.

E. Gradual Display by Direction: You can set the [Animation Angle] parameter, and shapes will be gradually displayed based on the angle.
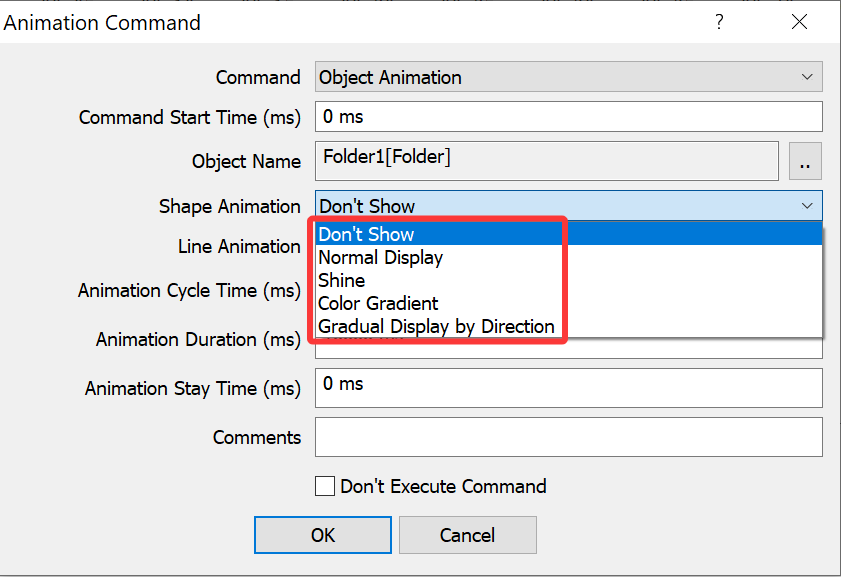
image-20260615160528960

Line Animation: The first 5 options are the same as [Shape Animation]. The additional option is [Gradually Display by Track Point], indicating that tracks will be gradually displayed based on track points.

Animation Cycle Time (ms): The time period required for the animation playback each time. You can set multiple cycle times.

Animation Duration (ms): The total time period required for the animation playback.

Animation Stay Time (ms): The stay period after the animation playback is completed.

Comments: You can add a description to this animation command.

After you set the parameters, click [OK]. In the [Map Animation Settings] dialog box, click [Add to Favorites] to add the animation to your favorites.

⑥ Play Audio

Select [Play Audio] from the command drop-down list. Set the parameters as needed. You can click the img button next to [Attachment Name] to select an audio file from the placemark attachment library.
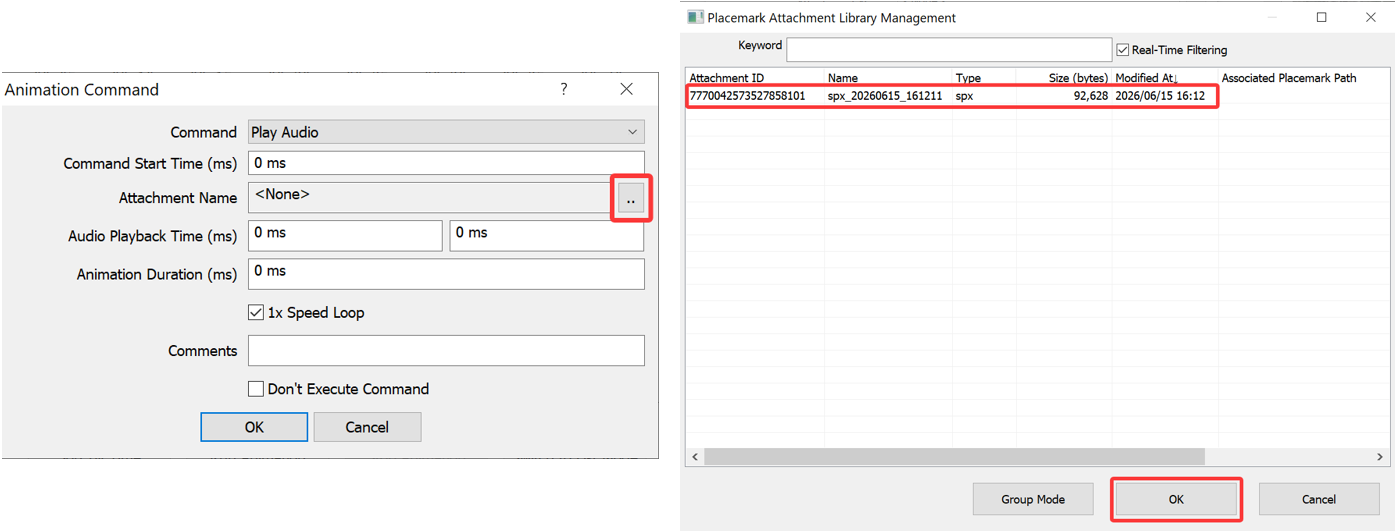
image-20260615161510349

After you set the parameters, click [OK]. In the [Map Animation Settings] dialog box, click [Add to Favorites] to add the animation to your favorites.

⑦ Play Image

This command is used to show placemark images on the map. Select [Play Image] from the command drop-down list. Set the parameters as needed.
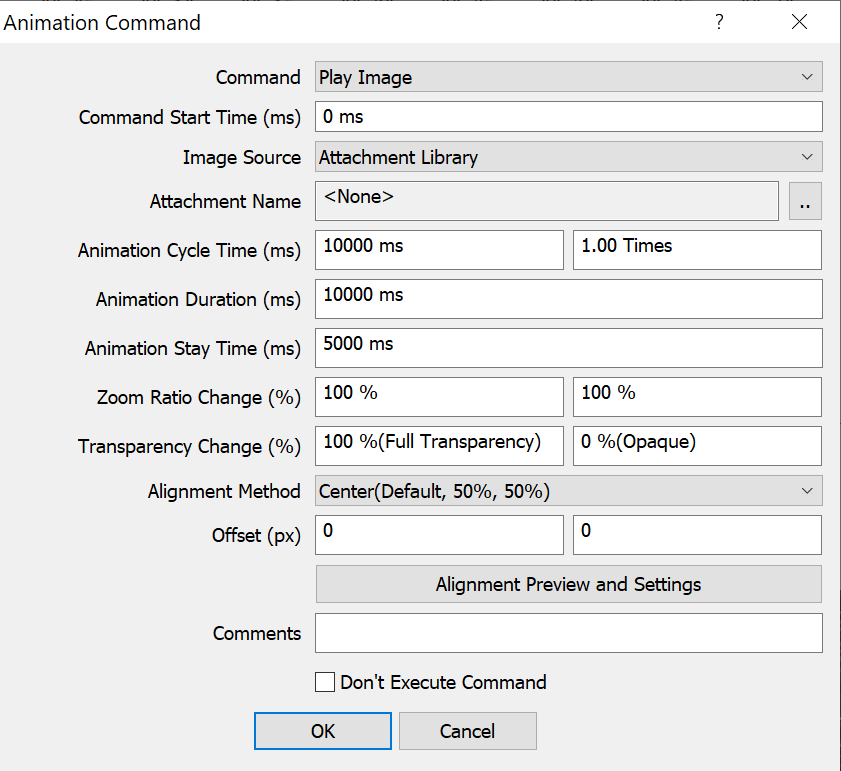
image-20260615161623917

Image Source: You can select images from placemarks or the attachment library.

A. If you select [Attachment Library], click the 3-2 icon next to [Attachment Name] to select image attachments from the attachment library;

B. If you select [Placemark Attachment], click the 3-2 icon next to [Placemark Name] to select one or more placemarks that have image attachments, as shown in the following figure:
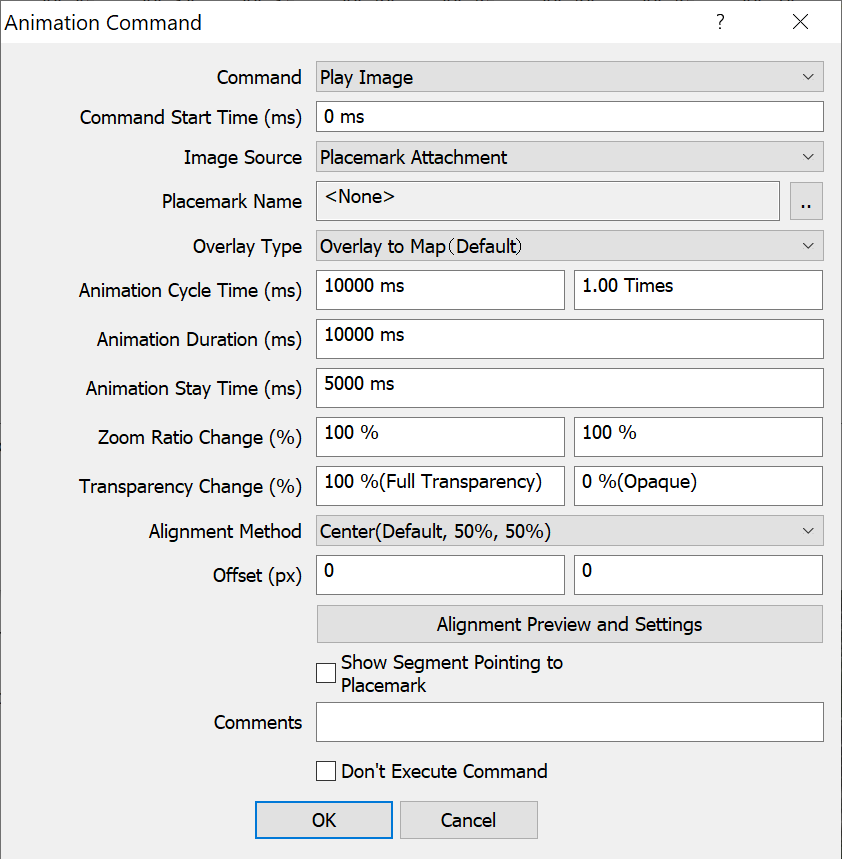
image-20260615161850110

Overlay Type: You can select [Overlay to Map (Default)] or [Overlay to Screen].

A. [Overlay to Map]: Images are aligned based on placemarks. If you select [Show Segment Pointing to Placemark], a line segment will be drawn from the displayed image to the corresponding placemark.

B. [Overlay to Screen]: Images are aligned based on placemarks based on the map window.

Set other parameters such as the animation time, zoom ratio, and transparency as needed.

Then, click [OK]. In the [Map Animation Settings] dialog box, click [Add to Favorites] to add the animation to your favorites.

⑧ Play Video

This command is used to show videos on the map. Select [Play Video] from the command drop-down list. Set the parameters as needed. You can click the 3-2 button next to [Attachment Name] to select a video file from the placemark attachment library.
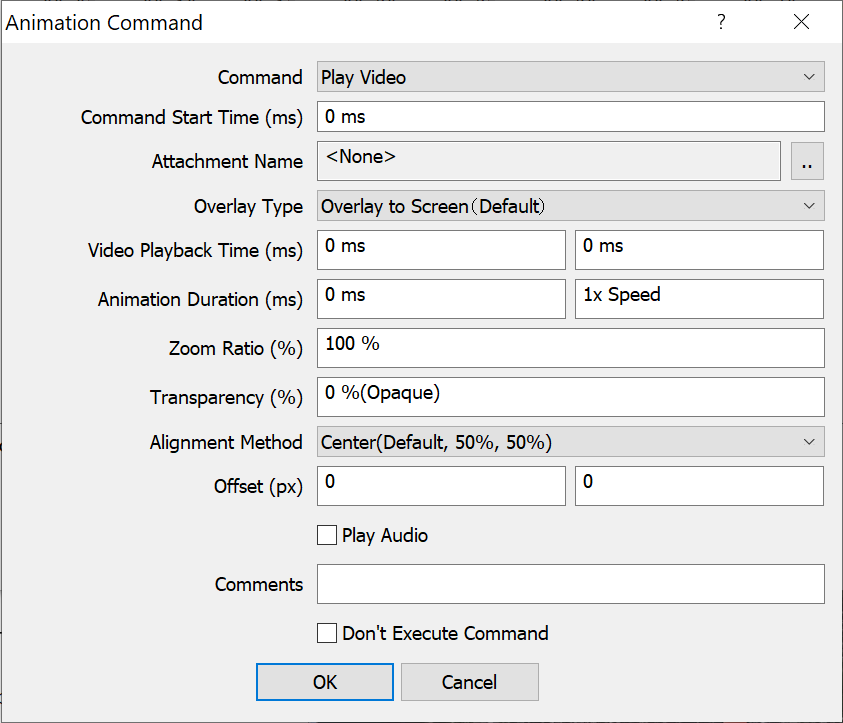
image-20260615162058012

Overlay Type: You can select [Overlay to Map] or [Overlay to Screen (Default)].

A. [Overlay to Map]: Images are aligned based on placemarks.

B. [Overlay to Screen]: Images are aligned based on placemarks based on the map window.

Set other parameters such as the animation time, zoom ratio, and transparency as needed.

Then, click [OK]. In the [Map Animation Settings] dialog box, click [Add to Favorites] to add the animation to your favorites.

⑨ Wait Command

This command is used to extend the duration of other animation commands so as to make the animation more orderly and organized. Select [Play Video] from the command drop-down list. Set the parameters as needed.
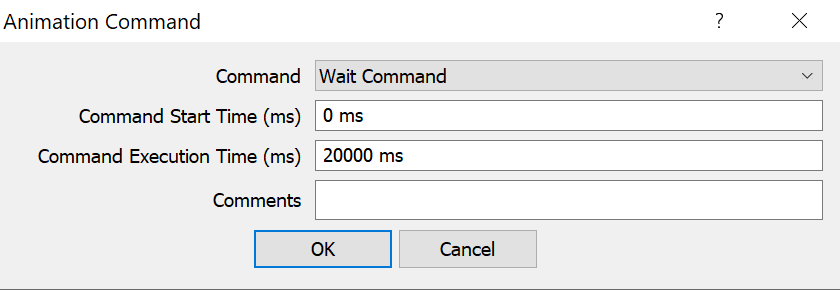
image-20260615161954783

Then, click [OK]. In the [Map Animation Settings] dialog box, click [Add to Favorites] to add the animation to your favorites.

⑩ Call Sub-Animation

This command is used to call an already created map animation (In this case, it is called “sub-animation”). Select [Call Sub-Animation] from the command drop-down list, and click the 3-2 button next to [Sub-Animation Name] to select an animation.
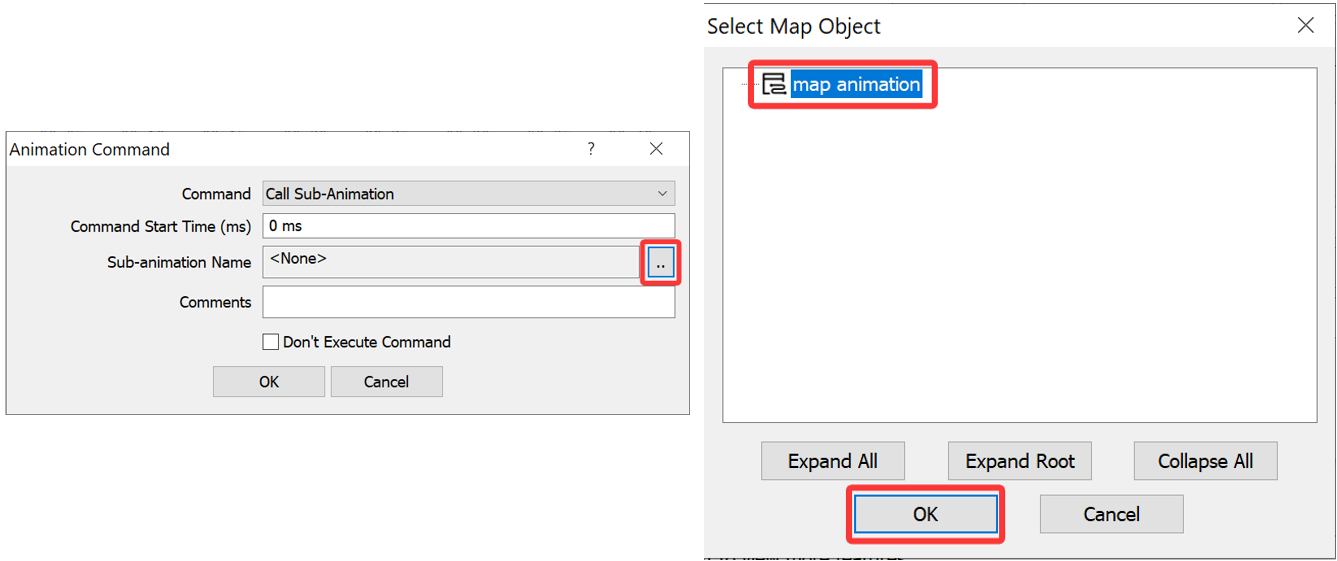
image-20260615162539703

Click [OK] → [OK]. In the [Map Animation Settings] dialog box, click [Add to Favorites] to add the animation to your favorites.

⑪ Switch Map

This command is used to achieve smooth transition between map layers and 2D/3D modes.

Select [Switch Map] from the command drop-down list. Set the [Map Type] and [3D/2D Mode] parameters as needed.
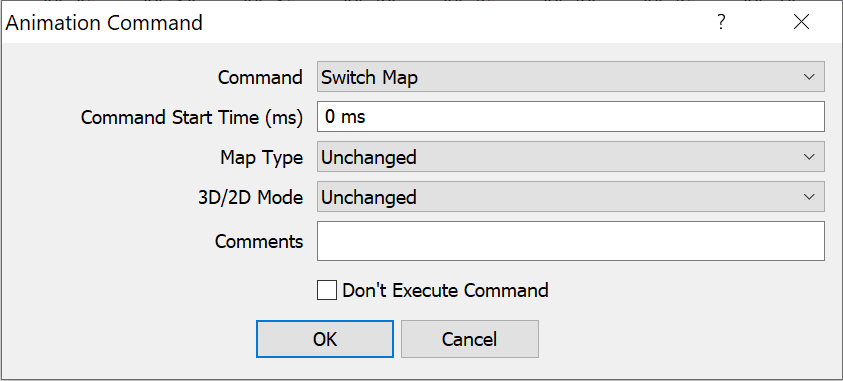
image-20260615162629107

Then, click [OK]. In the [Map Animation Settings] dialog box, click [Add to Favorites] to add the animation to your favorites.

⑫ Switch Object Display Status

The command is used to show or hide one or more objects on the map. Select [Switch Object Display Status] from the command drop-down list, and click the 3-2 icon next to [Object Name] to select the required objects.
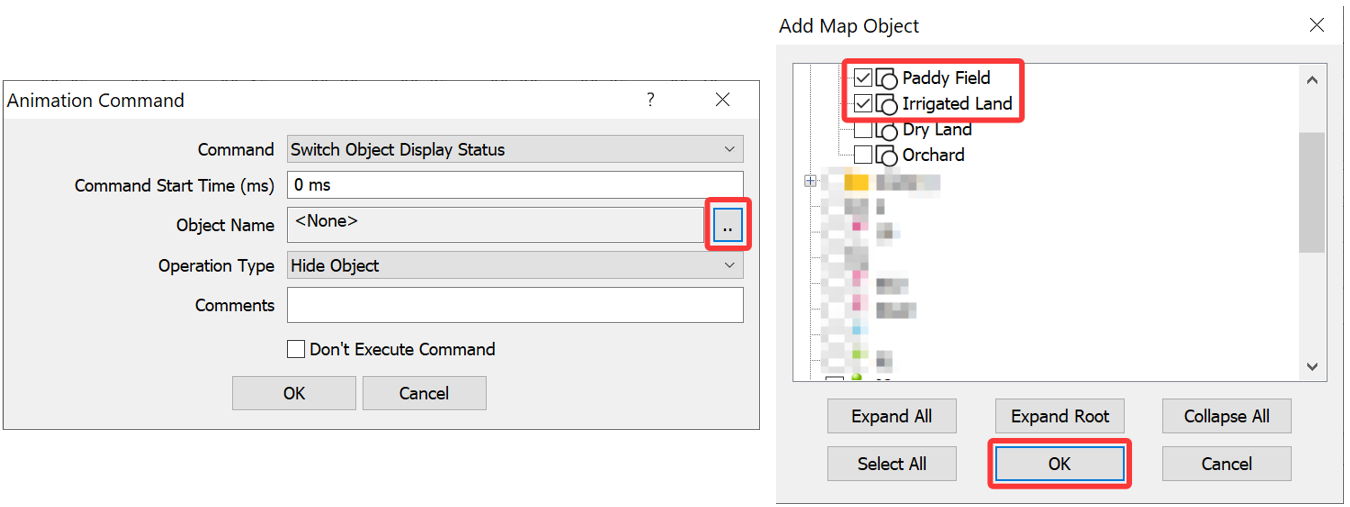
image-20260615163115022

Click [OK] → [OK]. In the [Map Animation Settings] dialog box, click [Add to Favorites] to add the animation to your favorites.

2. Play the map animation

Find the map animation in the favorites, and double-click it for playback.
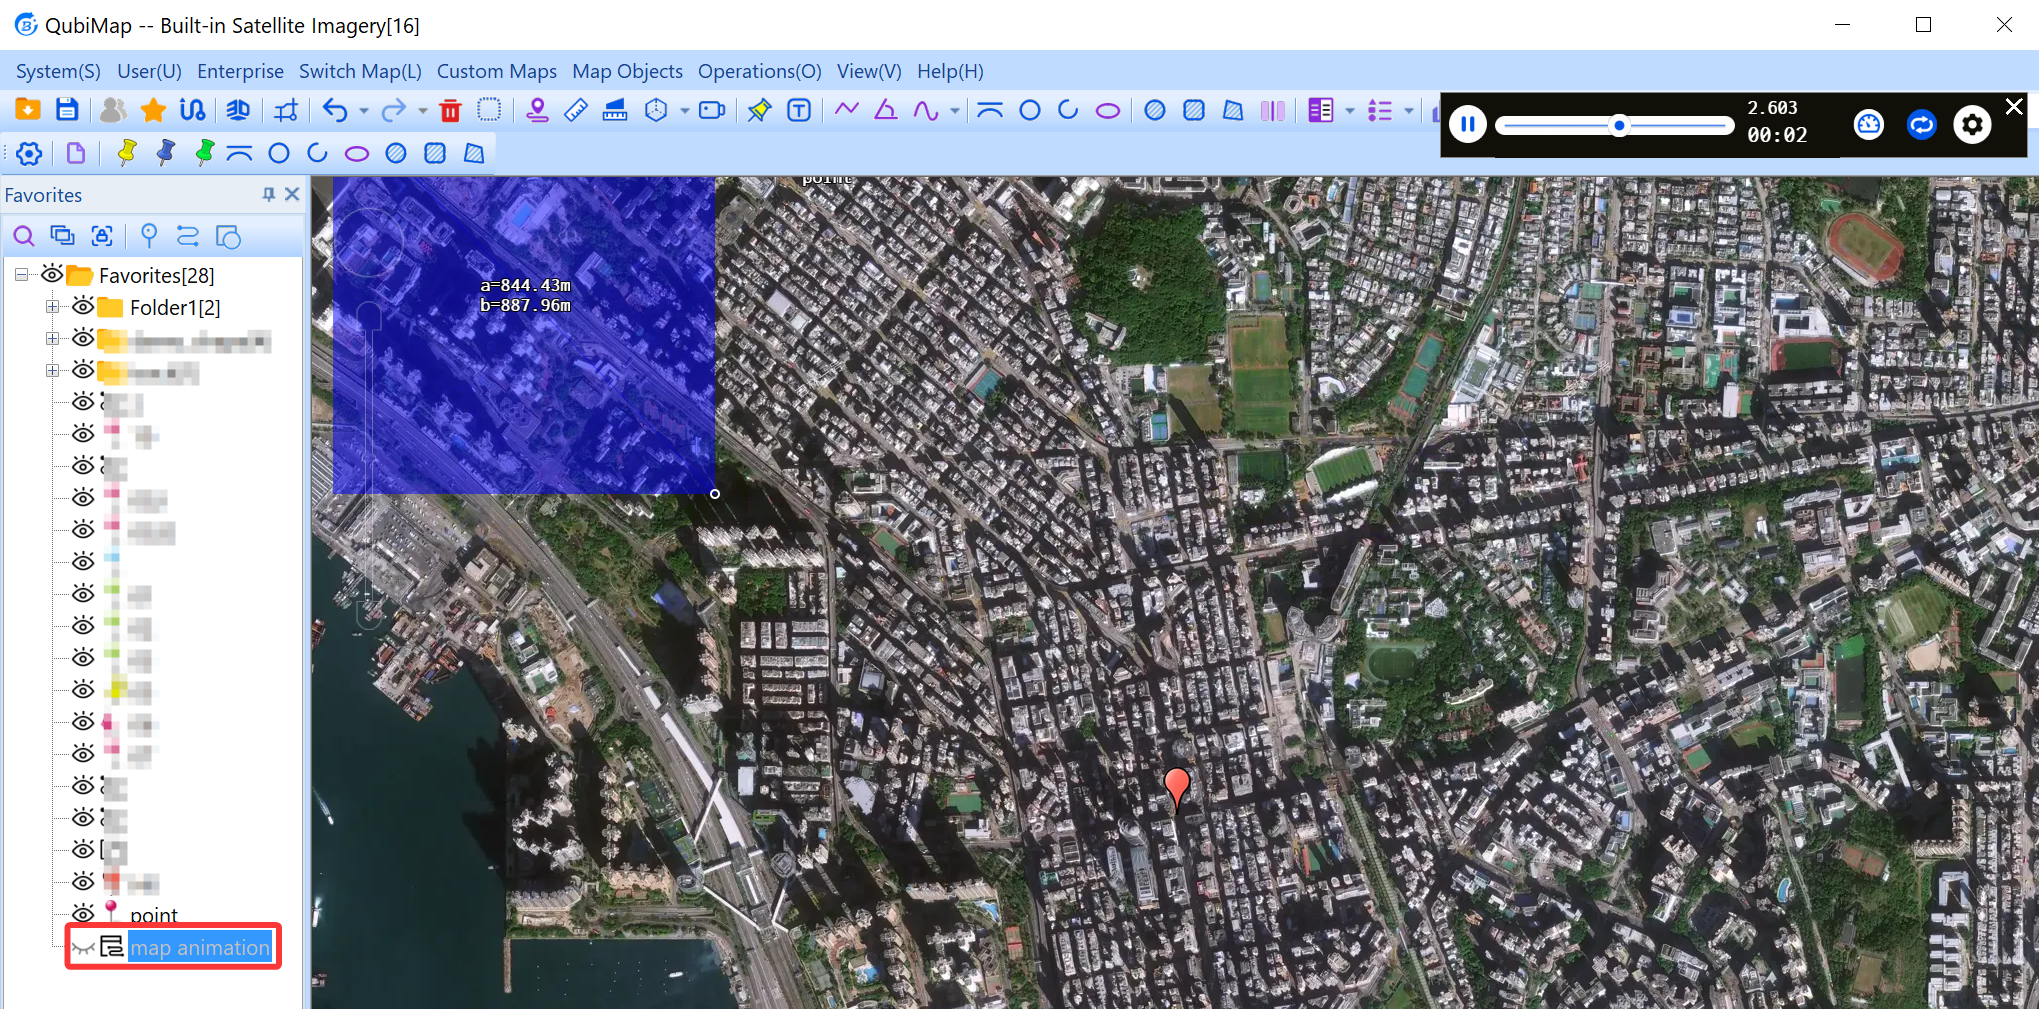
image-20260616092052414

3. Export the map animation as a MP4 video

Find the map animation in the favorites, right-click it, and select [Attributes]. In the [Map Animation Settings] dialog box, click [Export as MP4].
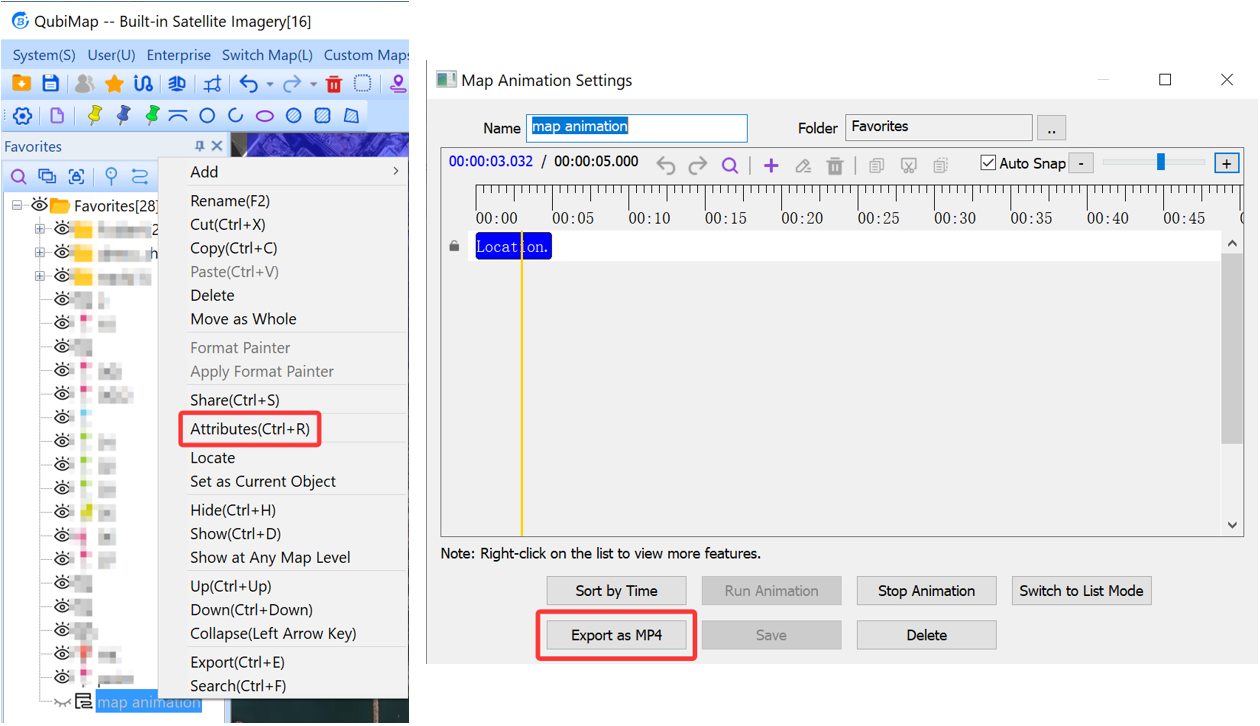
image-20260616093946307

In the [Video Settings] dialog box, click the 3-2 icon to set a file path, set the other parameters as needed, and click [OK].
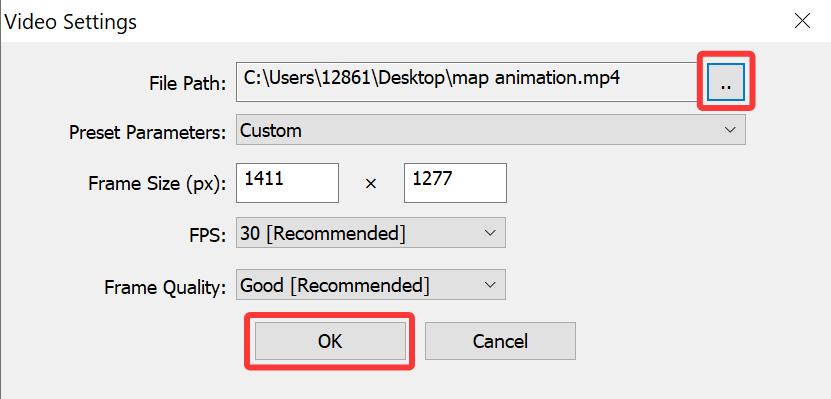
image-20260616094229702

Note: For the [Frame Quality] parameters, we recommend that you select [Good]. If you select [Best], the file size may be too large.

A message indicating that recording is in progress appears. After the video recording is completed, the window is automatically closed. If you want to cancel the operation, click [Stop Recording].
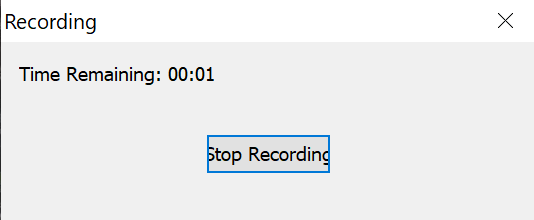
image-20260616094417427

The MP4 file is generated at the specified location.

4. List mode

In the [Map Animation Settings] dialog box, you can switch to list mode. Then, you can select an animation command, and right-click it to edit, delete, move up, move down, copy, cut, execute the command, adjust the start time, and switch between the execution/non-execution status.
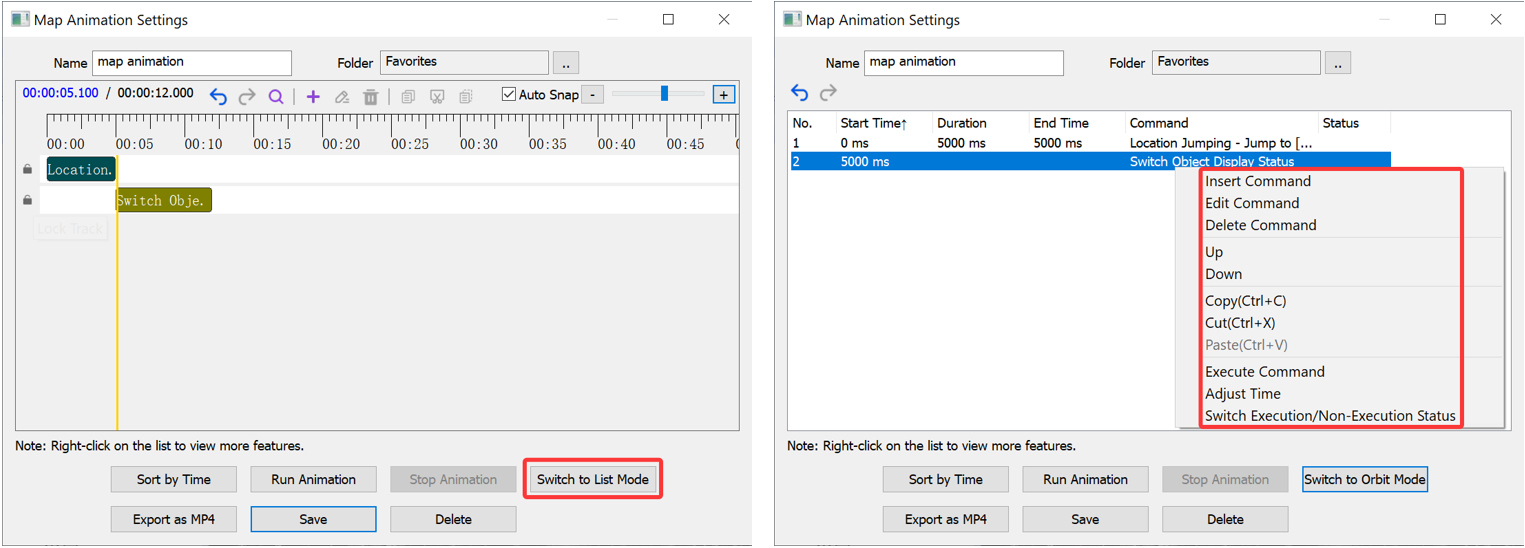
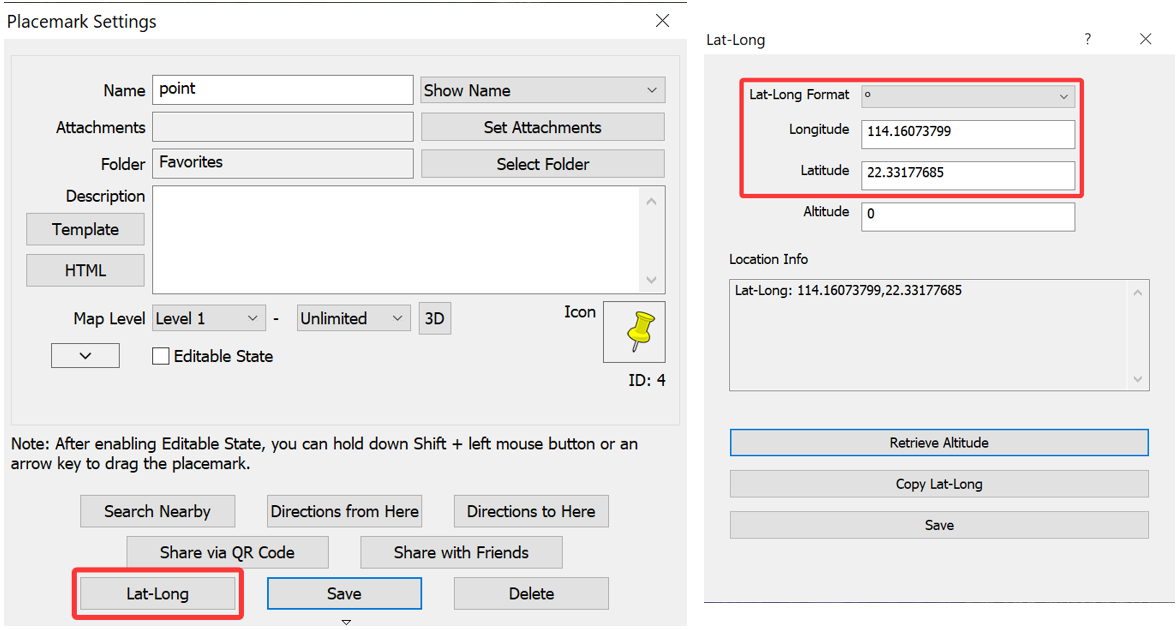
image-20260616095528448

In the [Placemark Settings] dialog box, click [Lat-Long]. In the [Lat-Long] dialog box, the Lat-Long information of the placemark is displayed. You can modify the latitude and longitude as needed.

image-20260616145729590

QubiMap supports synchronized playback of captured videos and associated tracks on PC. The procedure is described as follows:

(1) Record a track on QubiMap Mobile App

For details about how to record tracks on the QubiMap mobile app, see the help document “How to record tracks on the mobile app“.

After you record a track, sync the data to your computer. For more details, see the help document “How to sync favorites data between a mobile device and PC“.

You can export tracks (including time information) recorded in other software as files in a format that is supported by QubiMap and add them to QubiMap.

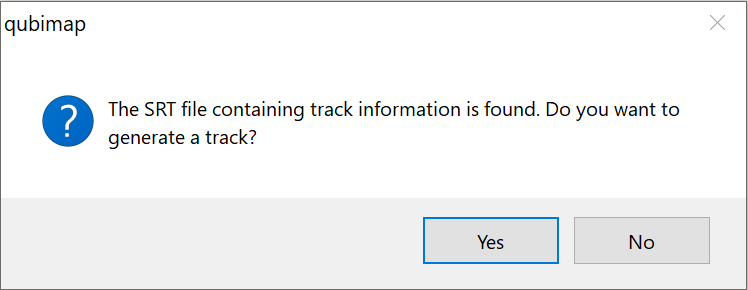
You can also add the .srt files (including track information) generated in the drone to QubiMap to generate tracks.

image-20260509164858685

(2) Record a video

Use a video recording device to capture a video based on the time of the track. Then, send the video to the computer.

(3) Play video and the associated track simultaneously on the computer

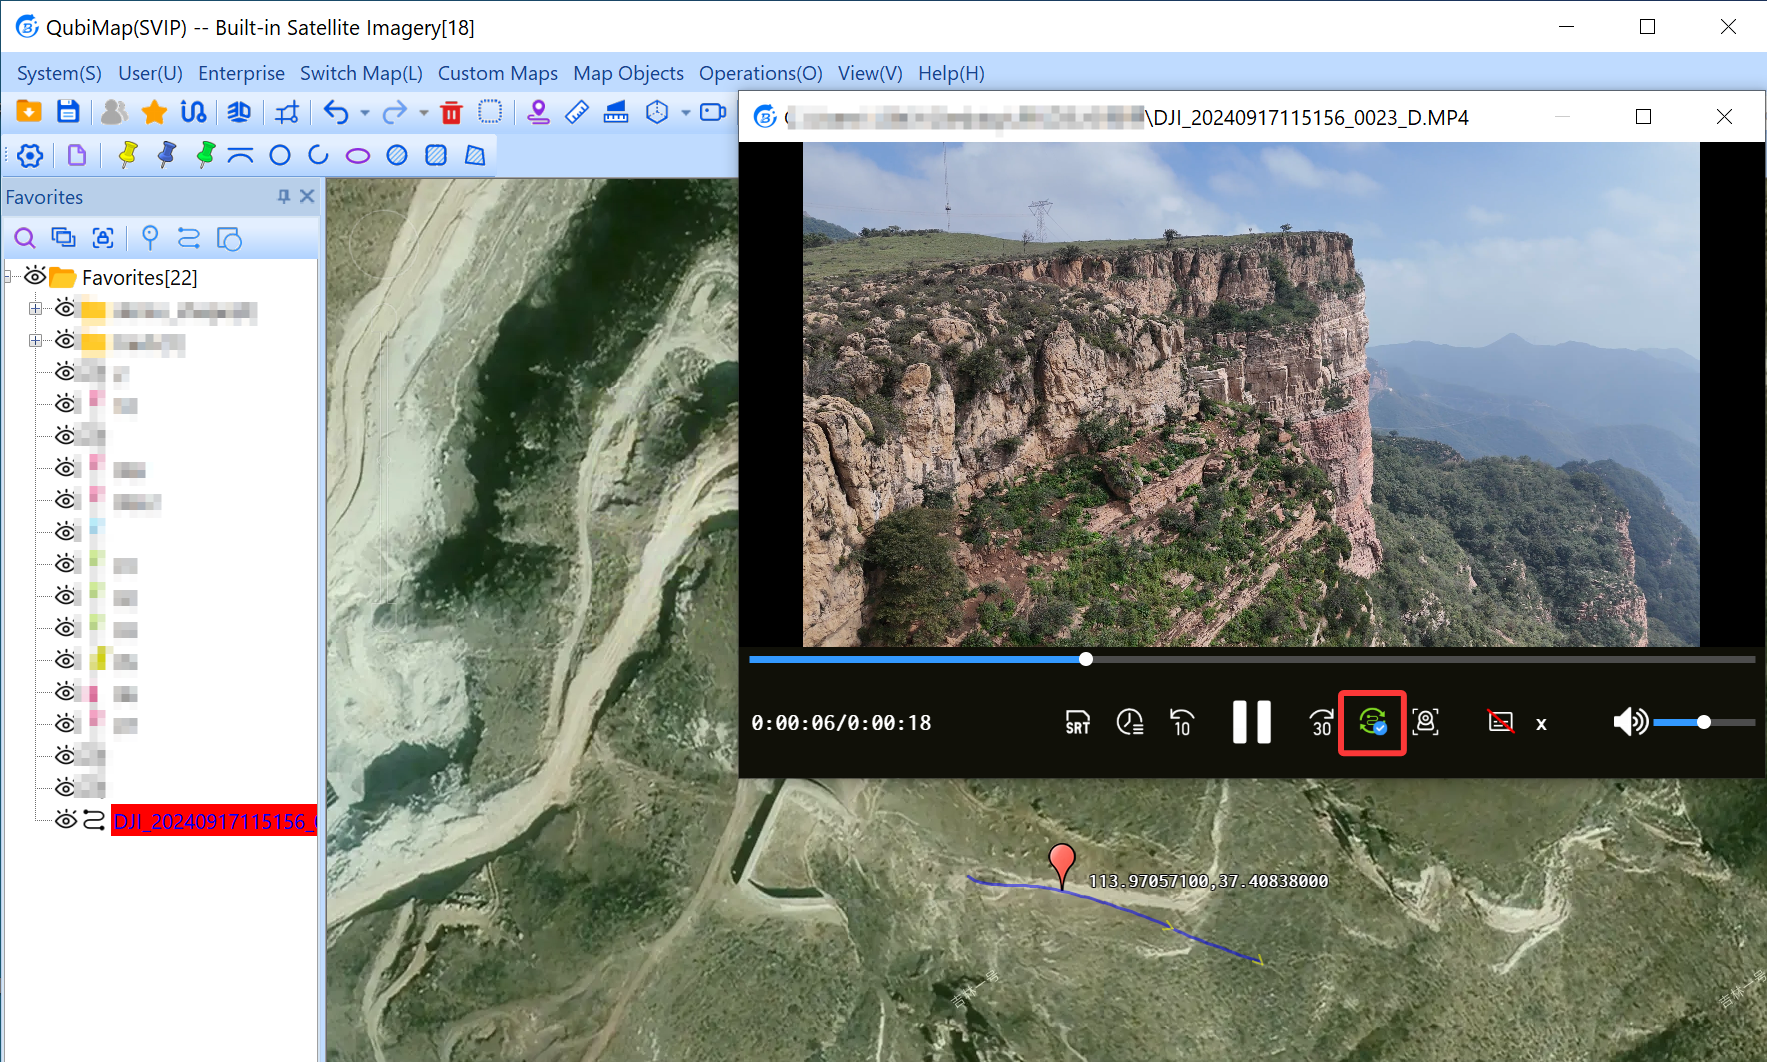
After the track recorded on the mobile device is synced to the computer, it is displayed in the favorites. Then, drag the video file into the QubiMap window, and click the Untitled-1 button in the video playback window.

image-20260509165406374

Buttons:

Untitled-1: Export a subtitle file containing the information such as latitude, longitude, speed, and altitude.

Untitled-1: Modify the video start time to match the video and track.

image-20251119151024229: Sync the track.

Untitled-1: Enable or disable track view following in 3D mode after you sync the track.
This article describes how to export track attribute details from a QubiMap folder to a CSV file.

(1) Find the folder containing the required tracks, right-click the folder and then select [Attributes] to go to the folder settings dialog box.

img

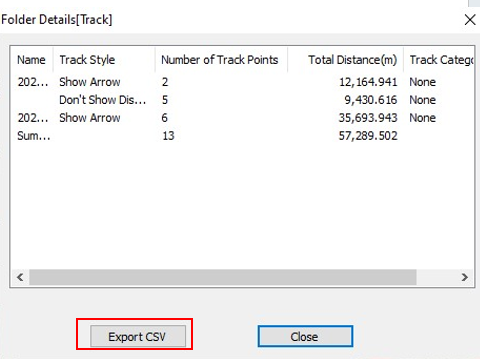
(2) Click the [Details] button to go to the folder details dialog box.

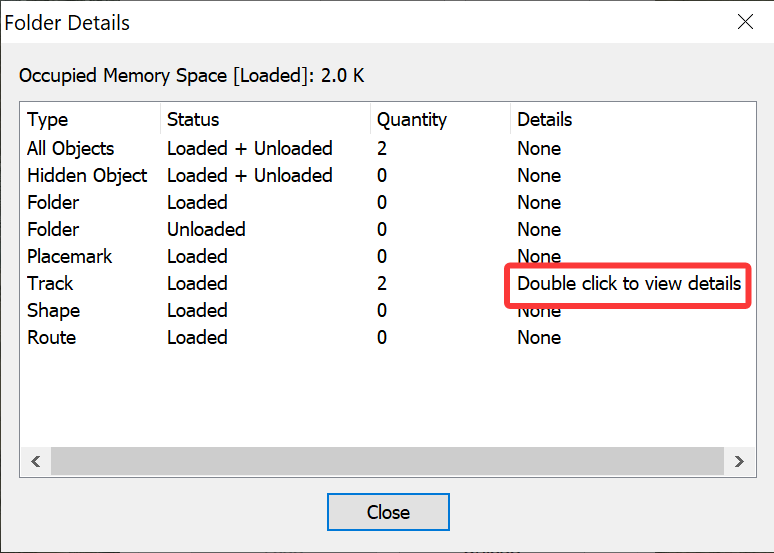
img

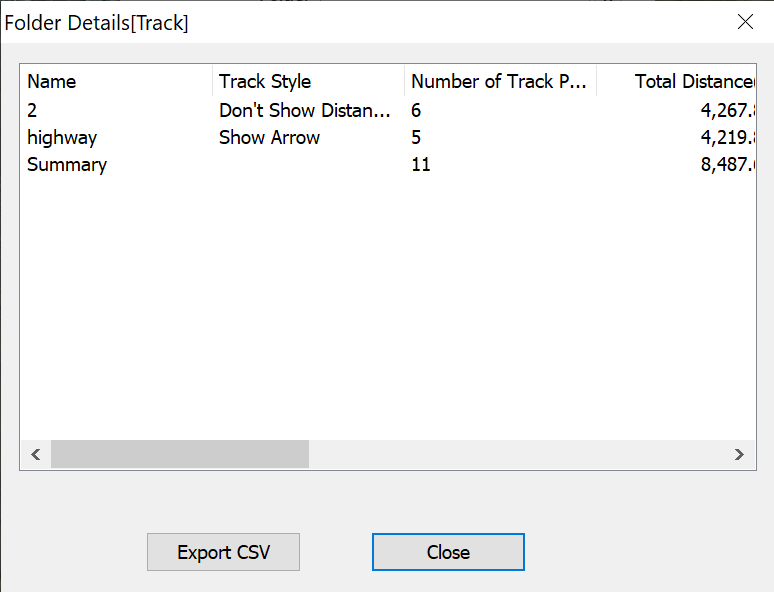
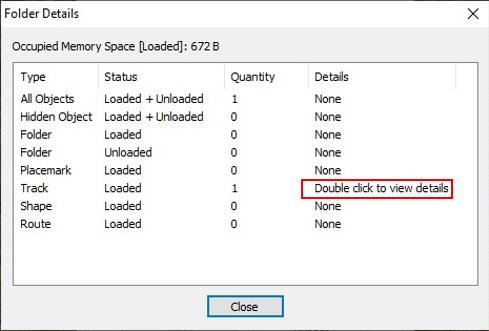
(3) Double-click the Track row to go to the track details dialog box.

img

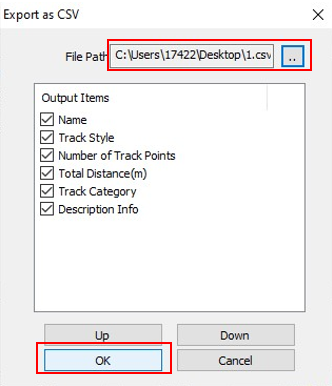
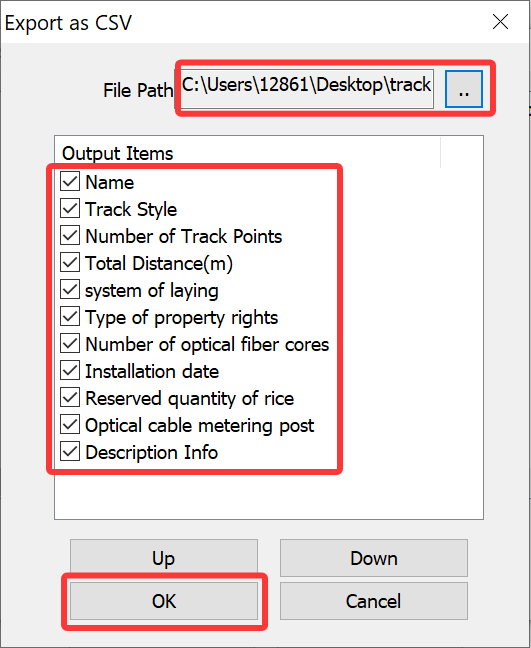
(4) Click the [Export CSV] button to go to the export settings dialog box.

img

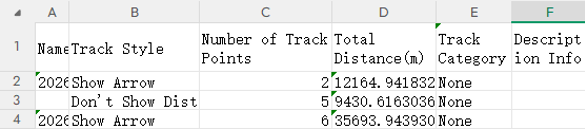
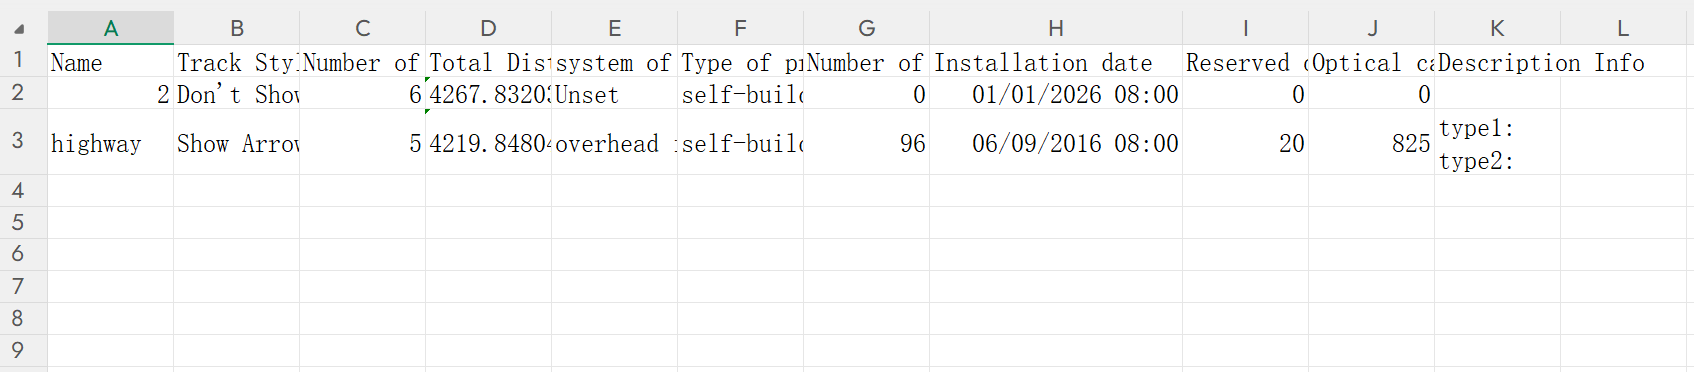
(5) Set the required file path and name, and then select the output items. You can adjust the order of the items as needed. Finally, click the [OK] button. You can open the saved CSV file with Excel for further editing, as shown in the following figure:

img

QibiMap supports importing WFS geographic features from the WFS server and rendering them on the map. Users can edit, modify, share, and export the imported geographic features.

This article describes how to import WFS objects.

1. Import WFS geographic features

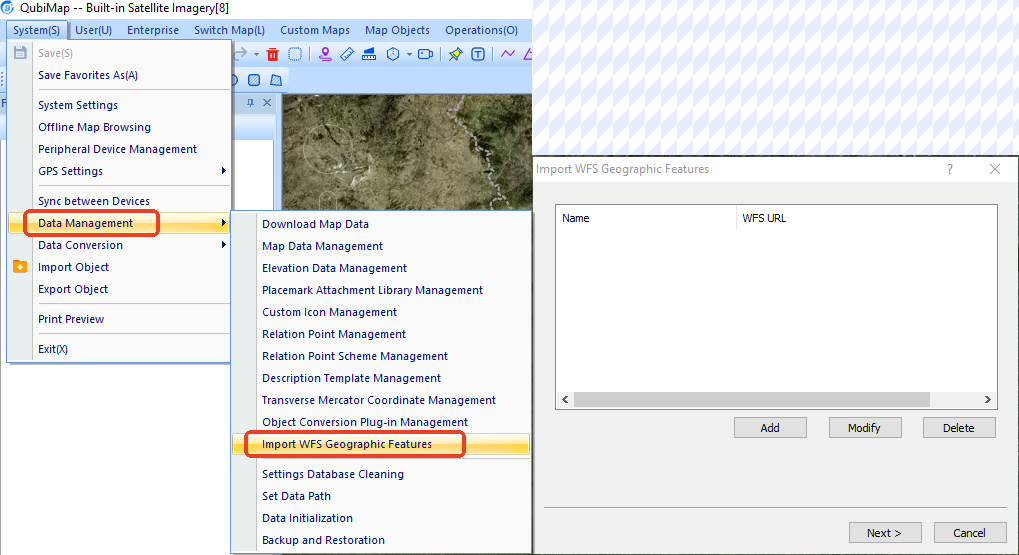
On the main UI, choose [System] > [Data Management] > [Import WFS Geographic Features].

img

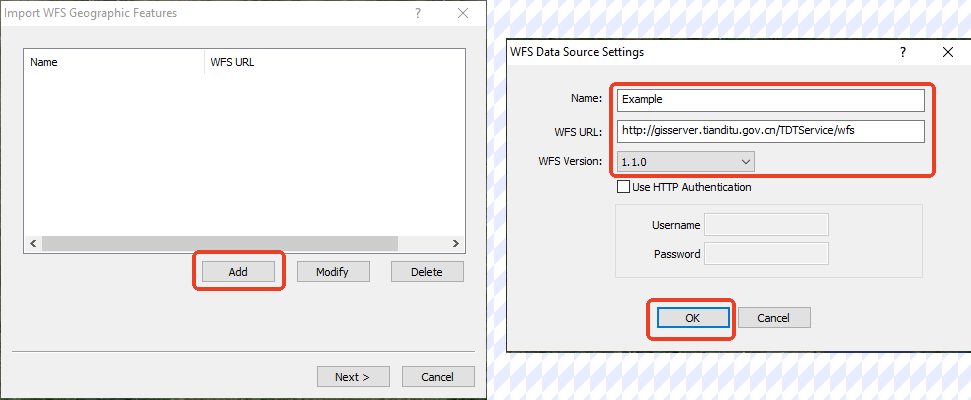
In the [Import WFS Geographic Features] dialog box, click [Add] to add a WFS server address. In the [WFS Data Source Settings] dialog box, specify a name, WFS URL and other parameters, and then click [OK].

img

img

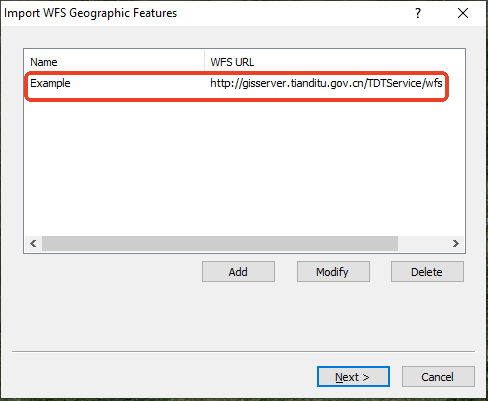
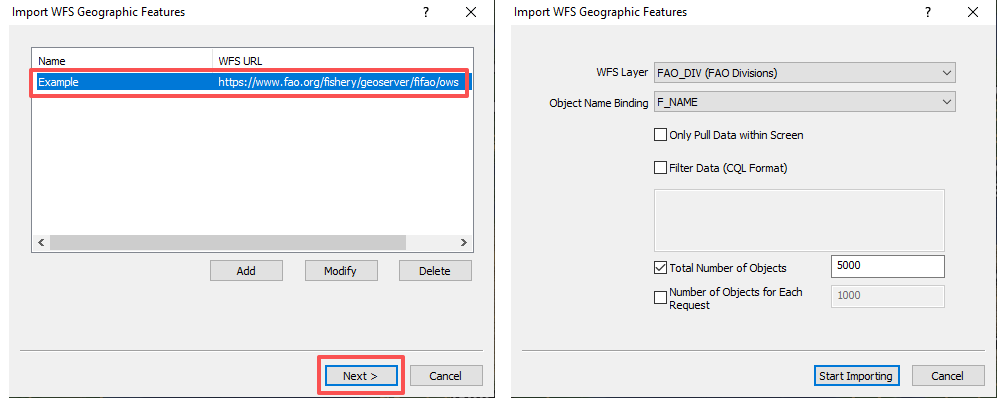
In the [Import WFS Geographic Features] dialog box, select the URL in the list, click [Next], and then set the parameters as needed.

2ScreenShot_2026-05-09_160134_351

★ Parameters:

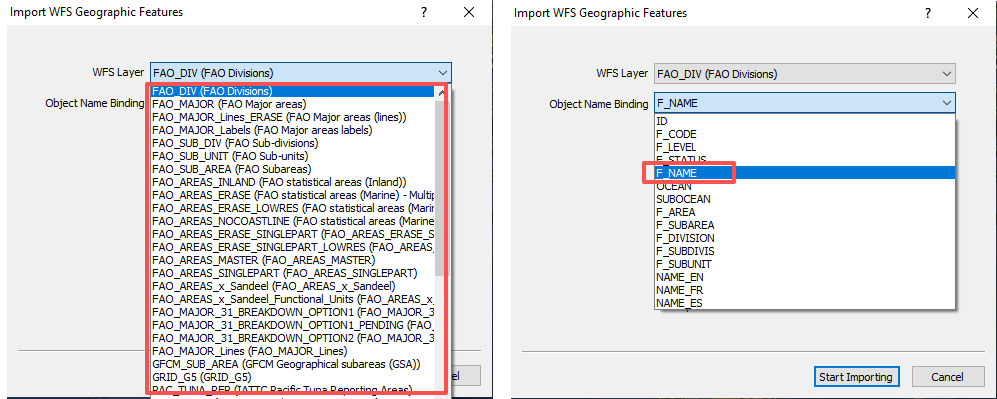
① WFS Layer: Select the layer you need to import.

② Object Name Binding: The selected field is displayed as the WFS object name in QubiMap.

1ScreenShot_2026-05-09_154907_367

③ Only Pull Data within Screen: If you select this option, only WFS objects within the screen area are extracted.

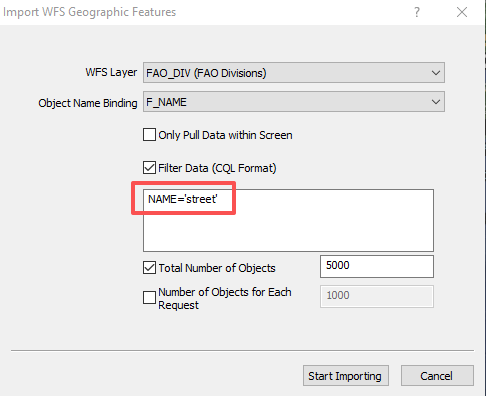
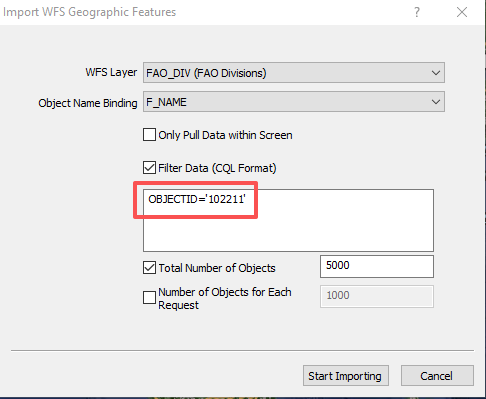
④ Filter Data (CQL Format): Set the CQL statement to extract data from the WFS layer.

Example:

​ ◆ NAME=’street’: Extract the element named “street”.

image-20260509155547416

​ ◆ OBJECTID=’102211′: Extract the element whose ID is “102211”.

image-20260509155633271

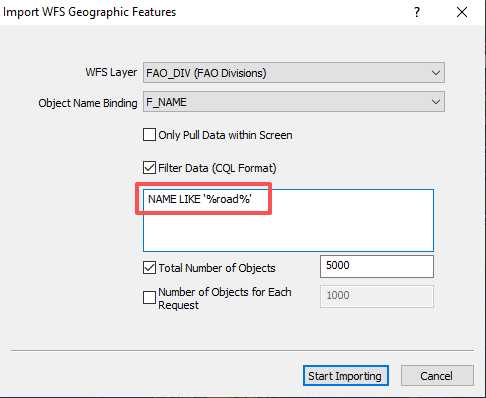
​ ◆ NAME LIKE ‘%road%’: Extract the element whose name contains the word “road”.

image-20260509155750301

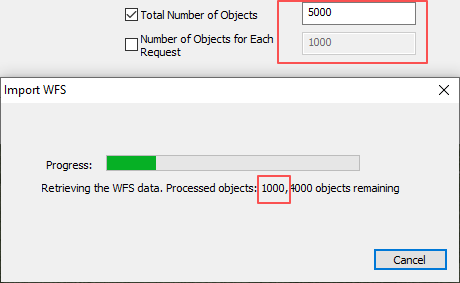
⑤ Total Number of Objects: Set the maximum number of objects that can be downloaded totally.

⑥ Number of Objects for Each Request: Set the maximum number of objects that can downloaded per request.

As shown in the following figure, the specified limits 5000 and 1000 indicate that 1,000 objects can be downloaded each time, and totally 5,000 geographic features can be downloaded.

image-20260509144654662

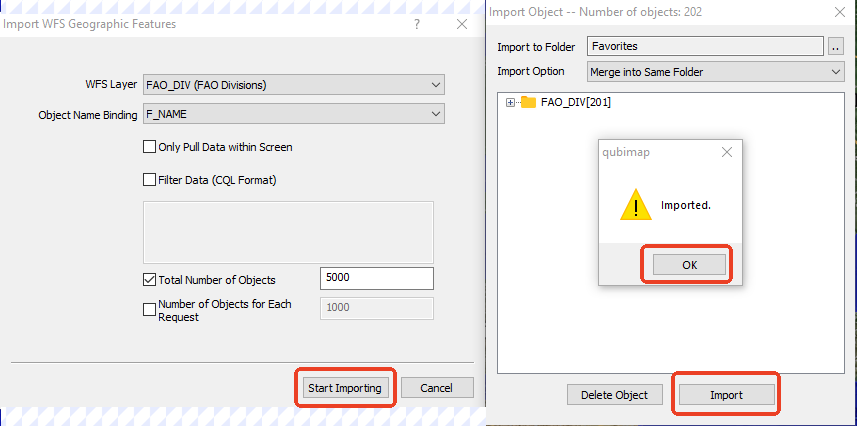
After you set the parameters, click [Start Importing] → [Import] → [OK].

image-20260509160720104

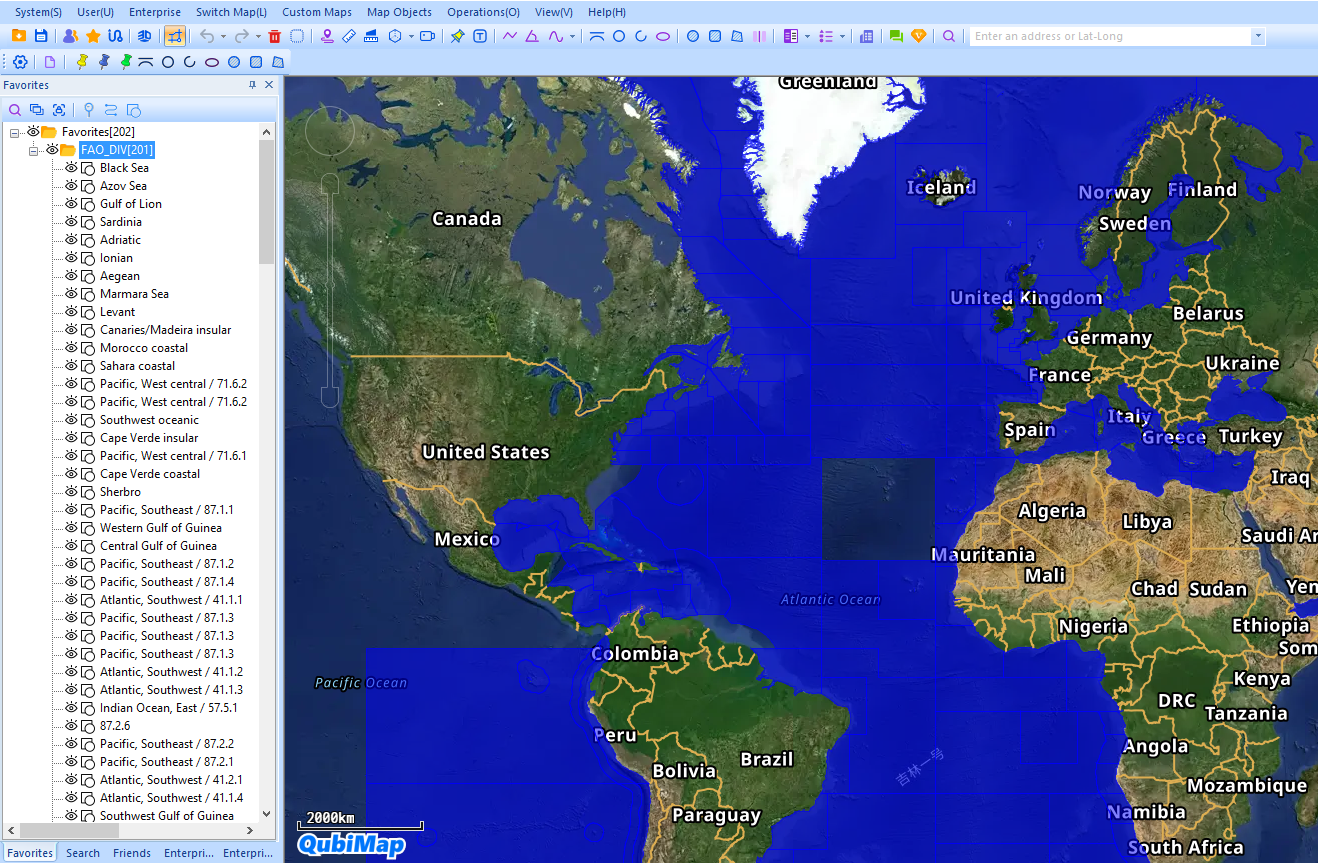
The imported data is saved in the favorites and displayed on the map.

image-20260509155902652

Common custom icons can only be used on local devices. To retrieve a custom icon from Device A and show it on device B, you must first export the icon from QubiMap on Device A, copy the icon to Device B, and then import it to QubiMap on Device B.
To improve efficiency, QubiMap provides cloud icons. When you create a cloud icon in QubiMap on Device A, the icon is assigned a unique ID. If you send a placemark with this cloud icon to a friend, and this icon does not exist on your friend’s device, it will be automatically download from the QubiMap cloud.
Note: 100 QubiMap Coins are required to create a cloud icon costs. Once created, the cloud icon with the unique ID belongs to the creator.

To dynamically demonstrate tracks and further help users plan, compare and analyze tracks to obtain the optimal solution, QubiMap provides the track tour animation feature. By using this feature, you can play a track as an animation, as if you are touring along the track.

This article describes how to use the track tour animation feature on the PC and mobile versions.

1. PC

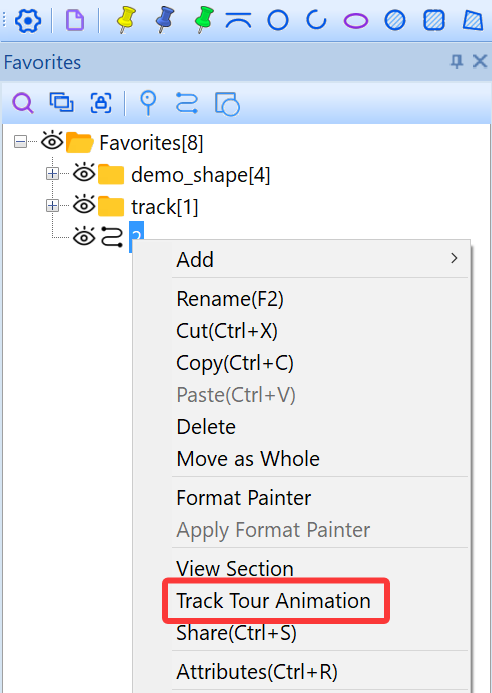
In your favorites, find the required track, right-click on it and select [Track Tour Animation].

image-20260316163517016

A progress slider and track tour settings are displayed in the upper right corner of the QubiMap window. You can control the playback and pause by using the button.

image-20231220114226129

You can also adjust the progress and locate where you want to view on the track by using the progress slider.

image-20231220114244953

The three buttons on the right side of the progress slider are used to specify the speed, loop, and detailed track tour settings. You can click the image-20231220114446167 button to set the playback speed, and click the Untitled-4 button to play the track animation in loop.

You can click the Untitled-5 button to set the track tour parameters as needed, such as viewpoint distance, placemark moving speed, azimuth, tilt, and placemark icon.
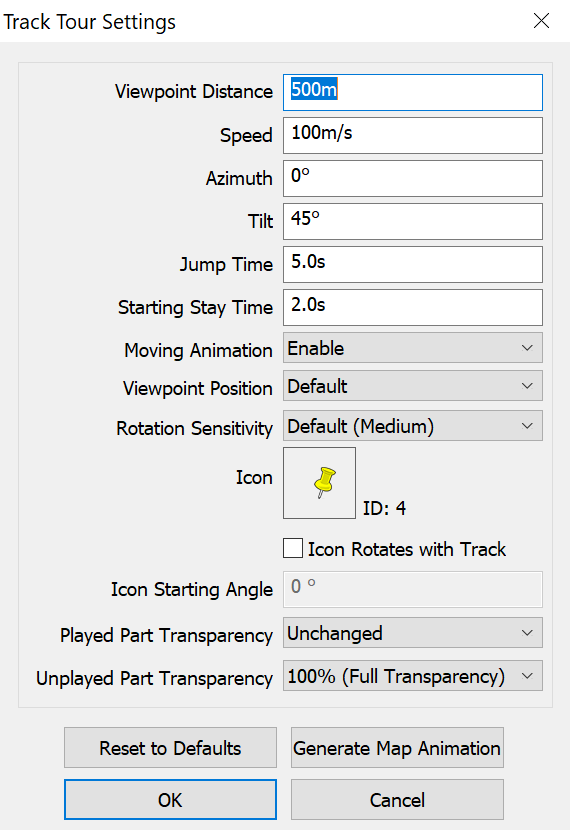
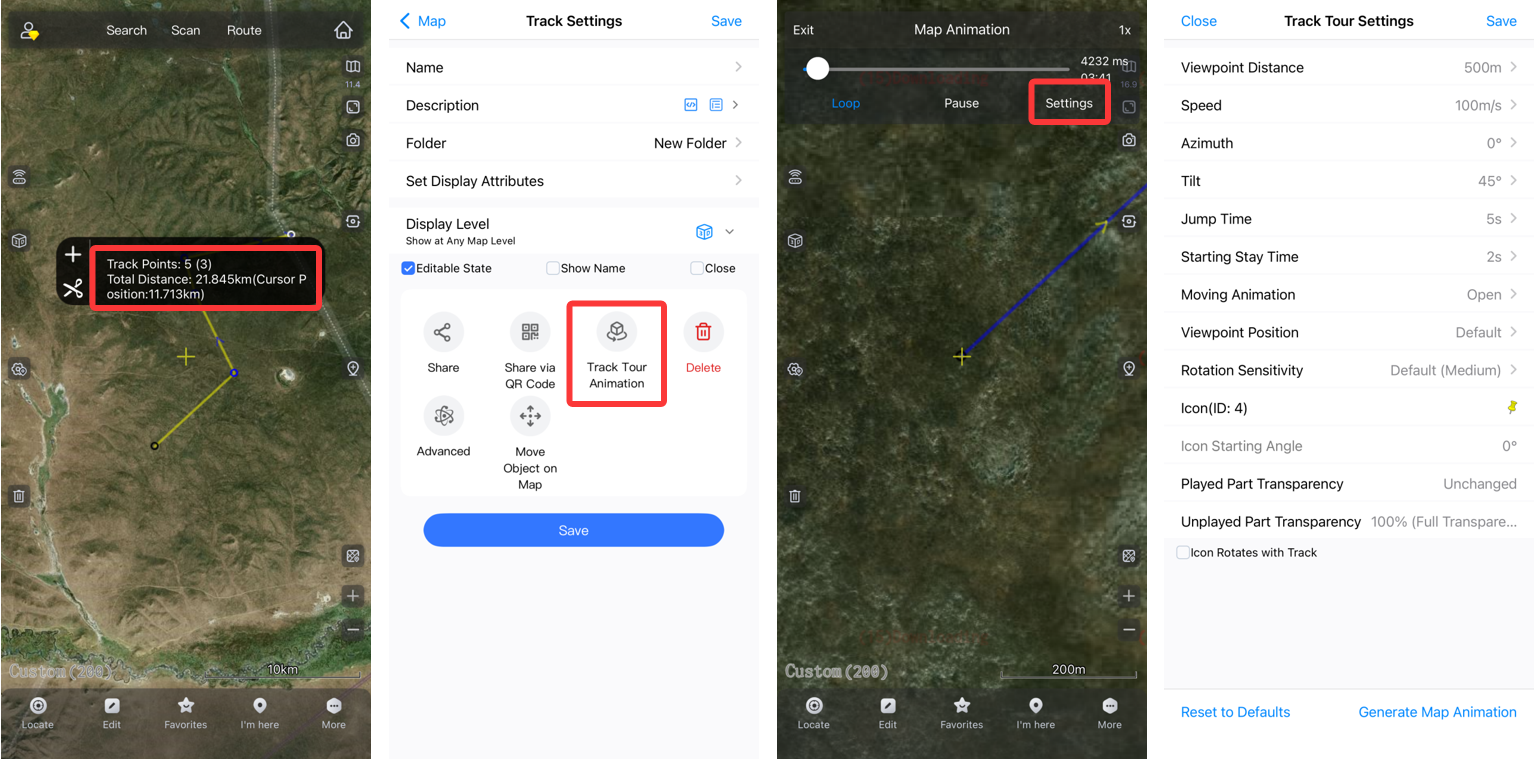
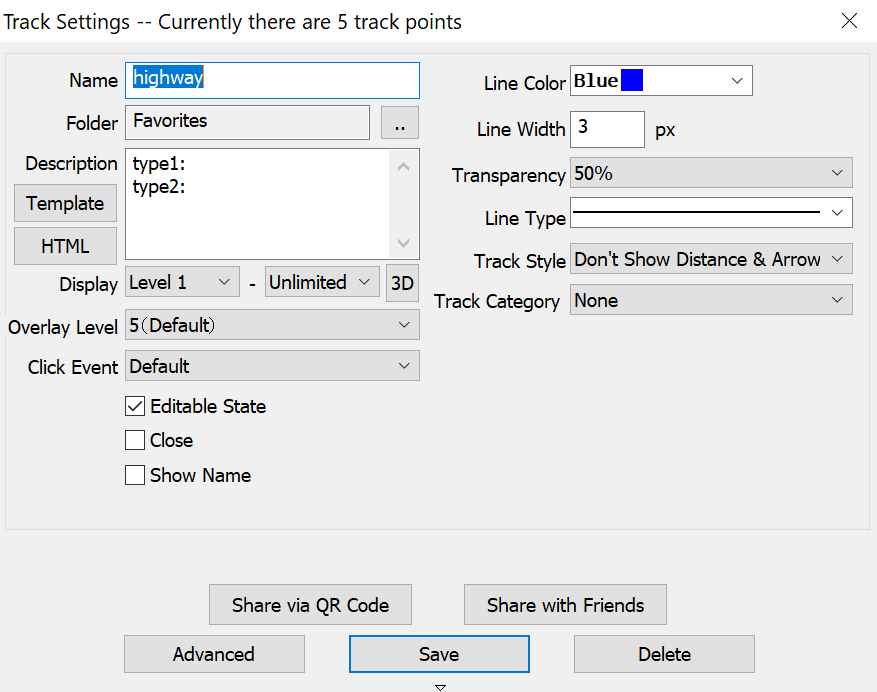
image-20260316163640922

2. Mobile device

On the map, find the required track, tap on the track, and then tap on the floating window that appears.

In the [Track Settings] dialog box, select [Track Tour Animation] to enter track tour mode.

You can customize the track tour parameters by clicking [Settings] in the upper right corner. The parameters include viewpoint distance, placemark moving speed, azimuth, tilt, placemark icon, and so on.

image-20260508145733551

To meet the business requirements in various industries, QubiMap provides the track attribute extension feature. VIP users can add custom track categories with user-defined attribute options as fields to the track settings, and also add two custom fields that can be used to specify time or integers to the extended information section of the track point editing dialog box. By using the folder statistics feature, you can view these custom categories, custom fields, and the summary value of all custom extended numbers for all track points and export the track statistics information to a CSV file for further processing in Excel.

This article uses the telecommunications industry as an example. The differences between the settings before and after configuration are shown as follows:

Before configuration: You can only use the default track settings to edit a telecommunications line. You cannot specify custom parameters except adding notes in the [Description] field. The following figure shows the default track settings:

image-20260313134617966

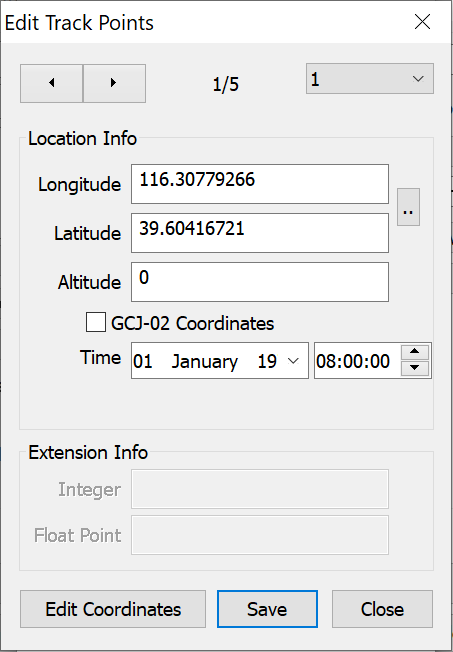
Before configuration: Choose [Advanced] > [Edit Track Points]. In the track point editing dialog box, you can only specify the location information, while the extended information section is uneditable.

image-20260313134808695

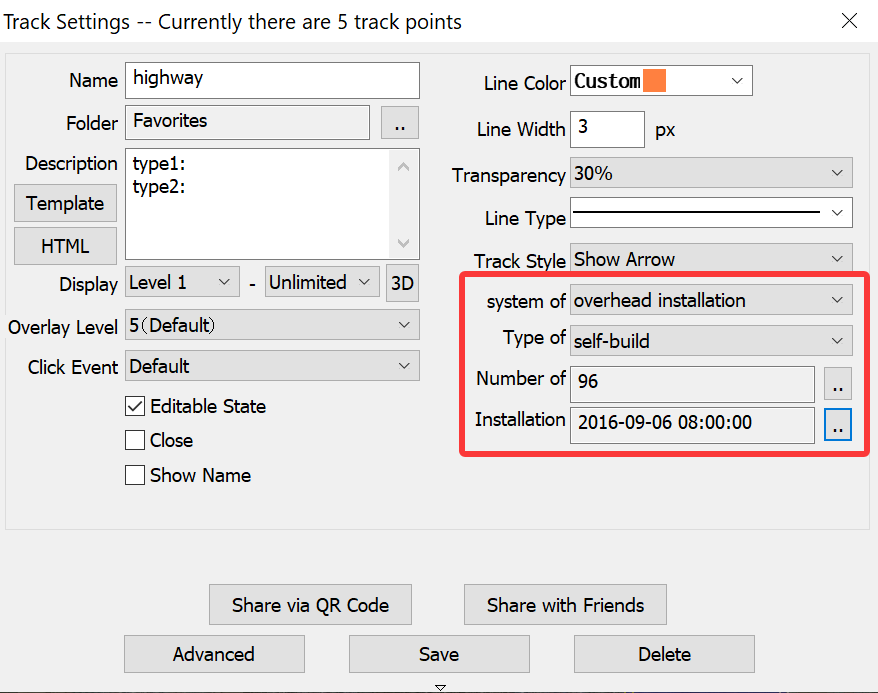
After configuration: In the track settings dialog box, the original [Track Category] field is replaced with several custom track category fields with user-defined attribute options. These fields can be displayed in the track statistics by using the folder statistics feature and can be exported as a CSV file.

image-20260313161524588

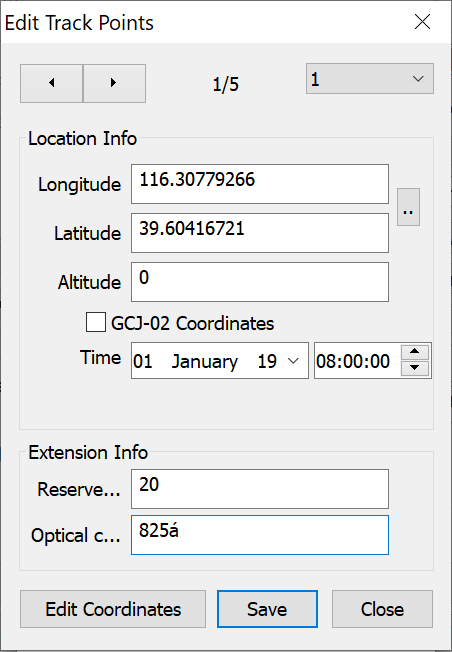
After configuration: Choose [Advanced] > [Edit Track Points]. In the track point editing dialog box, you can not only specify the location information, but also the custom extended information of track points.

image-20260313161626772

Note: When a track is in editable mode, you can right-click a track point and select the point to go to the the track point editing dialog box.

In this example, the track attribute extension settings are configured as follows:

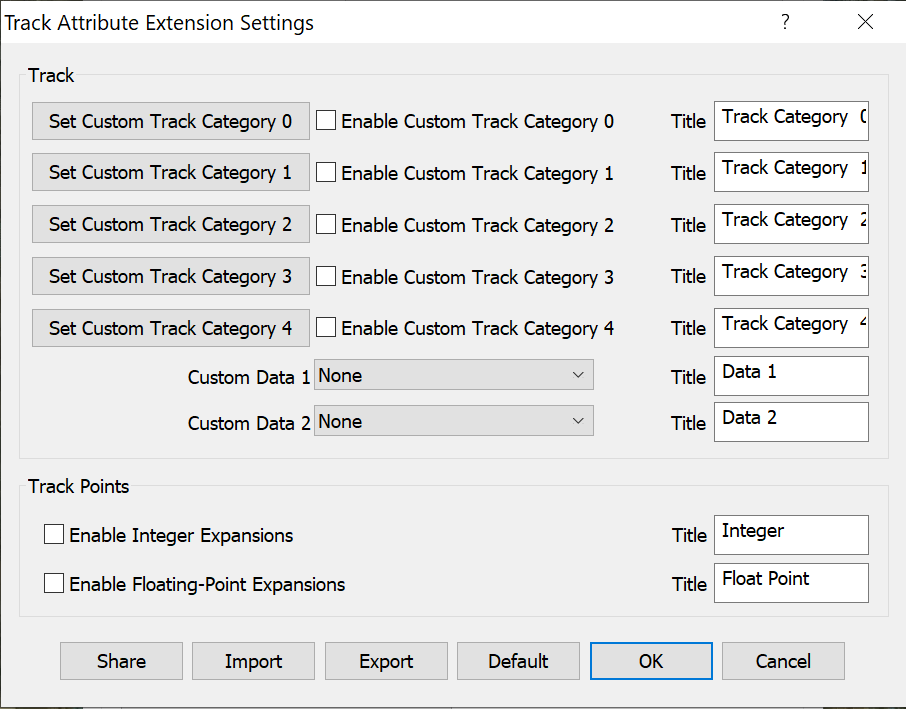
(1) Choose [System] > [System Settings] > [Track Attribute Extension Settings]. The following figure shows the default [Track Attribute Extension Settings] dialog box:

image-20260313135124382

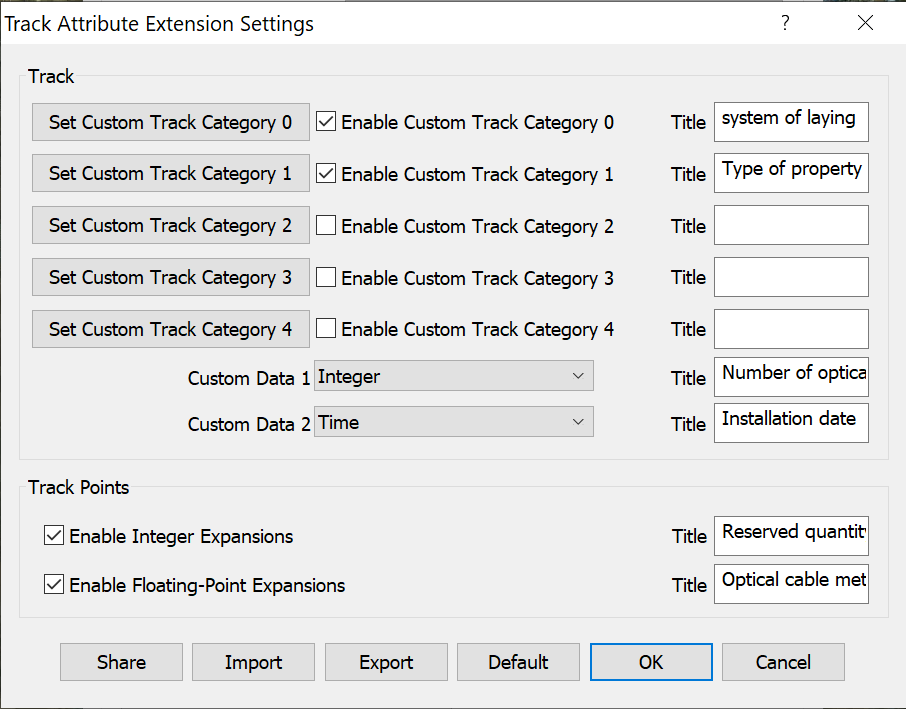
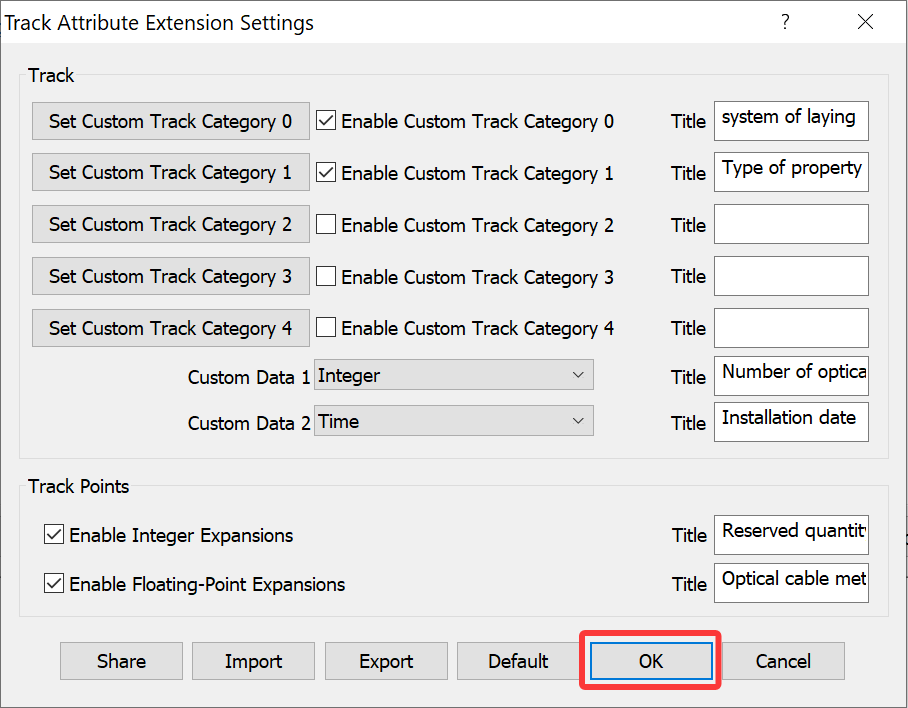
(2) Select the options and specify the titles as follows. These parameters as shown in the following titles (system of laying, type of property, number of optical fiber cores, installation date, reserved quantity, and optical cable meter) are commonly used in the telecommunications industry.

image-20260313140057780

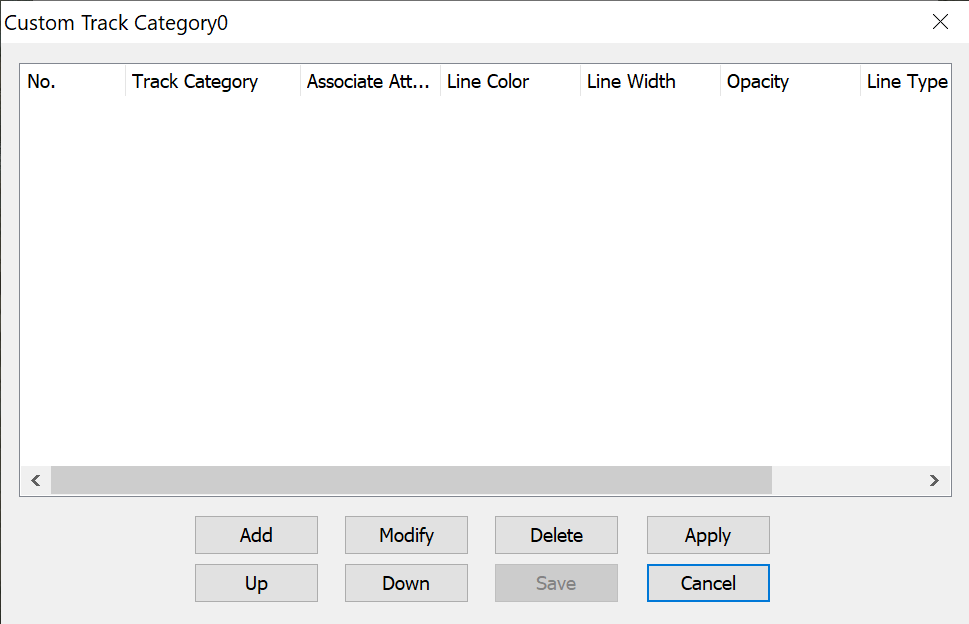
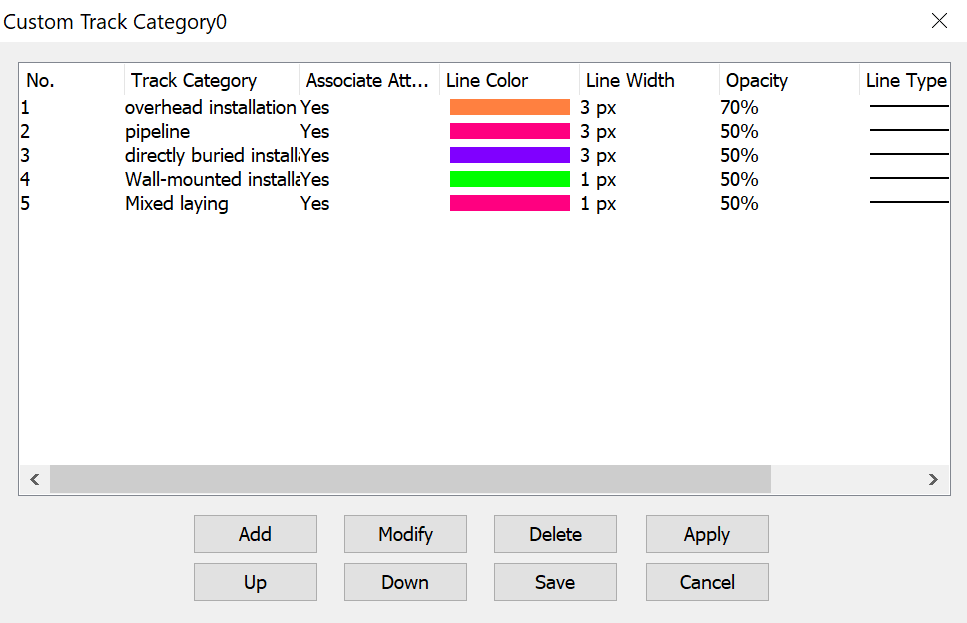
(3) Click [Set Custom Track Category 0] to go to the custom track category list.

image-20260313140218337

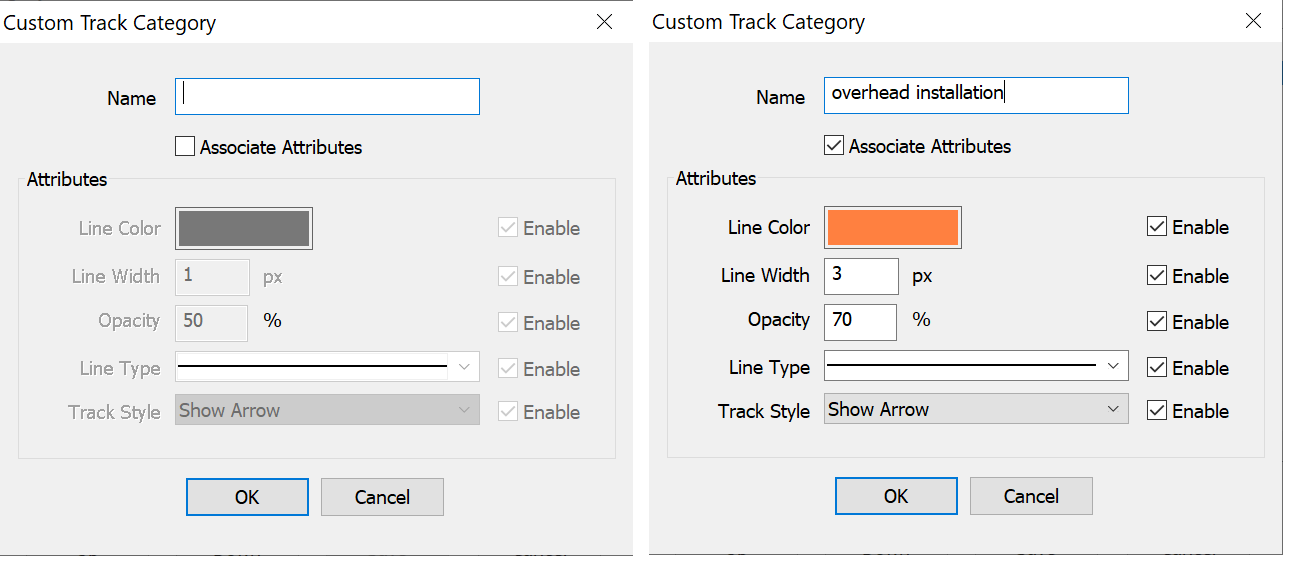
3-1) Click [Add] to add a track category option. In the [Custom Track Category] dialog box, specify a name as needed, and select the [Associate Attributes] option to set the track display attributes.

2d copy

Note: You must select [Associate Attributes] and set the display attributes, so that you can select this category option in the track settings to demonstrate the track with these associated attributes.

3-2) Click [OK] to return to the custom track category list. You can add other track category options based on your needs.

image-20260313144318269

If you need to modify a track category option, select the required item, and click [Modify].

If you need to delete a track category option, select the required item, and click [Delete].

To adjust the order of a track category option, select the required item, and click [Up] or [Down].

If a track category option in the list has associated attributes, you can click [Apply] to apply them to the tracks of this category.

3-3) Click [Save] to save the changes made to the list. The current dialog box is also closed.

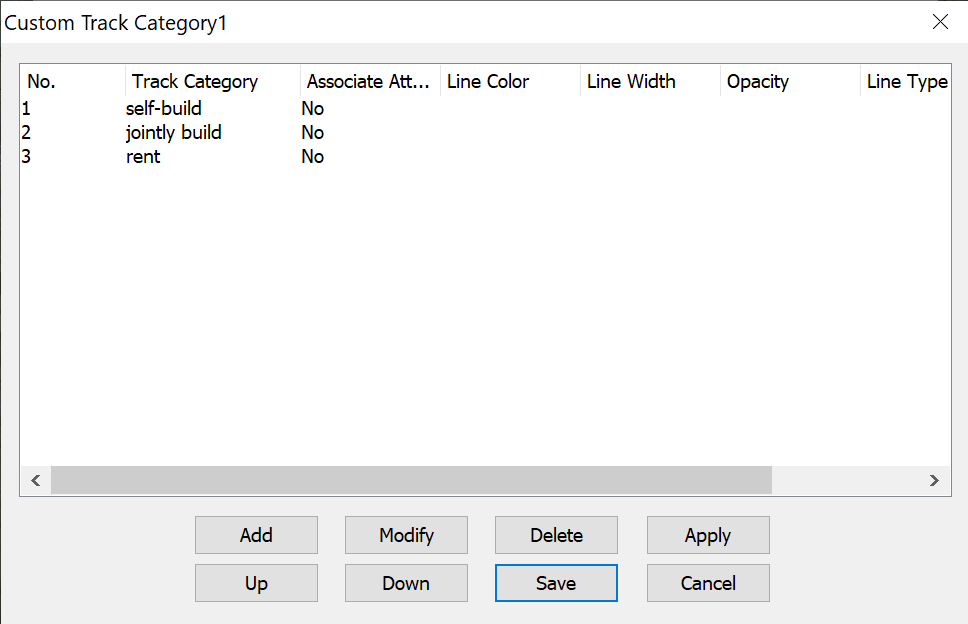
(4) In the [Track Attribute Extension Settings] dialog box, click [Set Custom Track Category 1] to set another custom track category. The steps are the same as in (3). The following figure shows the custom track category list after configuration:

image-20260313145851960

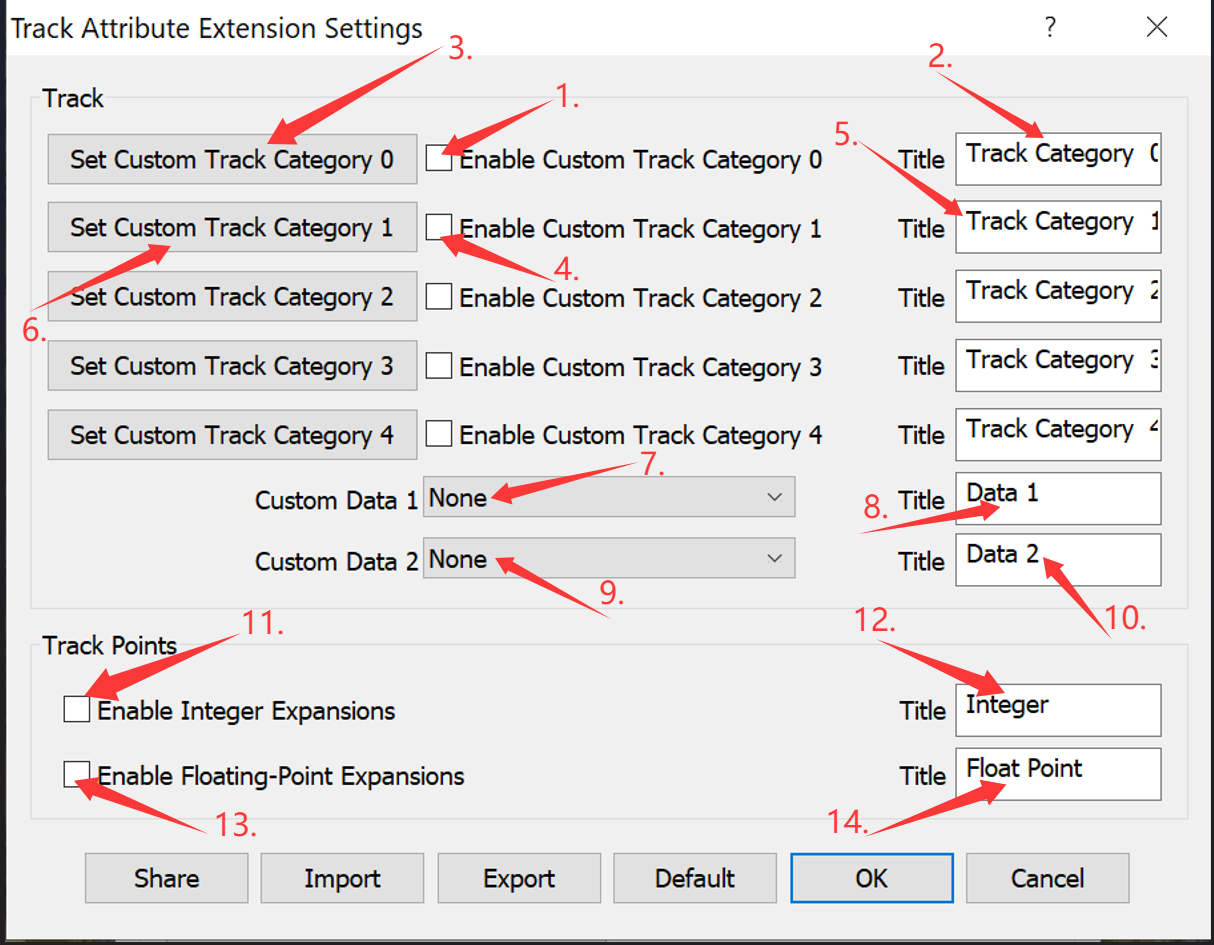
How to set parameters in the [Track Attribute Extension Settings] dialog box

image-20260313151944661

  1. Select [Enable Custom Track Category 0]. Only when you select this option, the specified category title can be displayed as a field in the [Track Settings] dialog box, and the category options as the field values.

  2. Specify the category title. The default title is [Track Category 0]. You can change it to an actual category name based on business requirements. For example, ‘system of laying’ is a category commonly used in the telecommunications industry.

  3. Click [Set Custom Track Category 0]. You can add category options and set relevant display attributes for each option.

  4. Select [Enable Custom Track Category 1] to add another track category.

  5. Specify the category title. The default title is [Track Category 1]. You can change it to an required category name. In this example, ‘type of property’ is used.

  6. Click [Set Custom Track Category 1] to set options for this category.

  7. Select the type of Custom Data 1 from the drop-down list. None: The field for Custom Data 1 is not used and will not be added to the track settings. Integer: The field is used to specify an integer and will be added to the track settings. Time: The field is used to specify a time point and will be added to the track settings.

  8. Specify the title. The default title is [Data 1]. Enter the required title based on the data type set in step 7, such as ‘number of optical fiber cores’ in this example.

  9. Select the type of Custom Data 2 from the drop-down list.

  10. Specify the title. The default title is [Data 2]. Enter the required title based on the data type set in step 9, such as ‘installation date’ in this example.

  11. Select [Enable Integer Expansions] in the [Track Points] section. This allows you to specify an integer value in the extended information section of the track point editing dialog box.

  12. Specify the title. The default title is [Integer]. Enter the required title as needed, such as ‘reserved quantity’ in this example.

  13. Select [Enable Floating Point Expansions]. This allows you to specify a floating point value with up to three decimal places in the extended information section of the track point editing dialog box.

  14. Specify the title. The default title is [Floating Point]. Enter the required title as needed, such as ‘optical cable meter’ in this example.

How to share track attribute extension settings

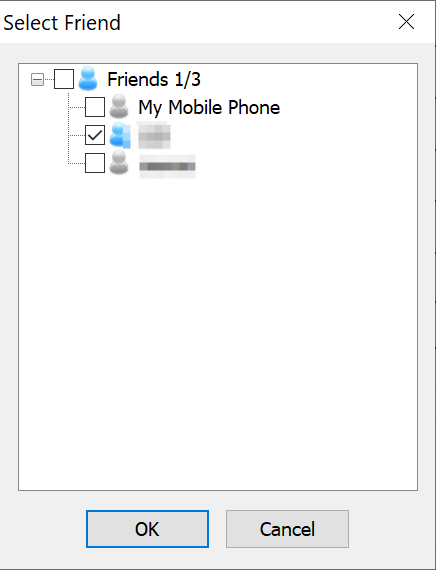
(1) Click [Share] in the [Track Attribute Extension Settings] dialog box. In the [Select Friend] dialog box that appears, select the friend you want to share with:

image-20260313162146013

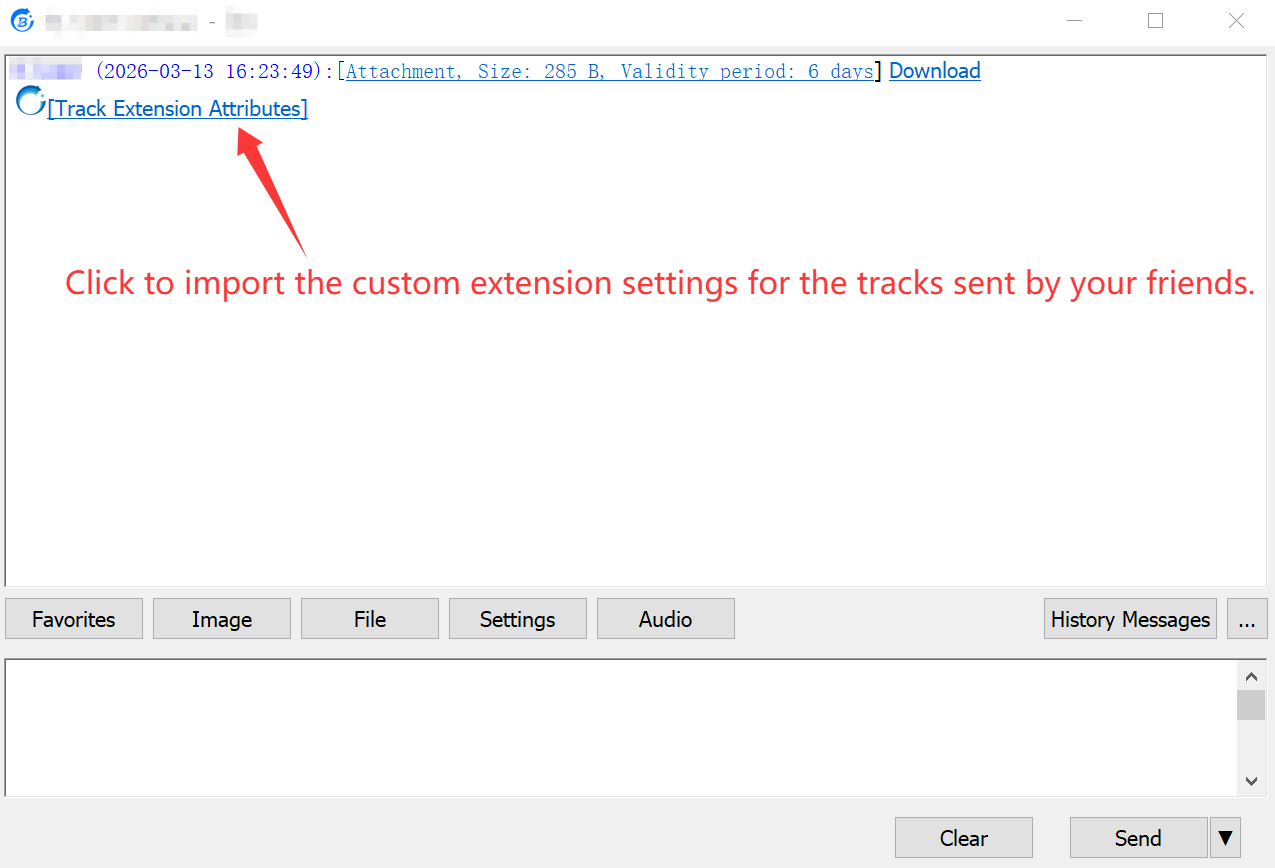
(2) Your friend receives the message from you. He can download and import the track attribute extension settings by performing the following steps:

2-1) Click [Track Extension Attributes] in the dialog box.

image-20260313163939450

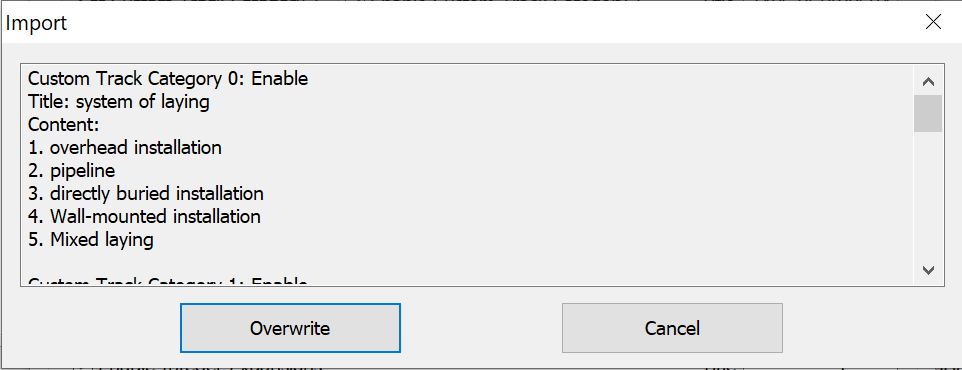
2-2) In the following attribute importing dialog box that appears, click [Overwrite] to overwrite the local settings.

image-20260313164124086

3-3) In the [Track Attribute Extension Settings] dialog box, click [OK]. This way, your friend can use the same track attribute extension settings to edit tracks.

image-20260313164237128

How to export track attribute extension settings

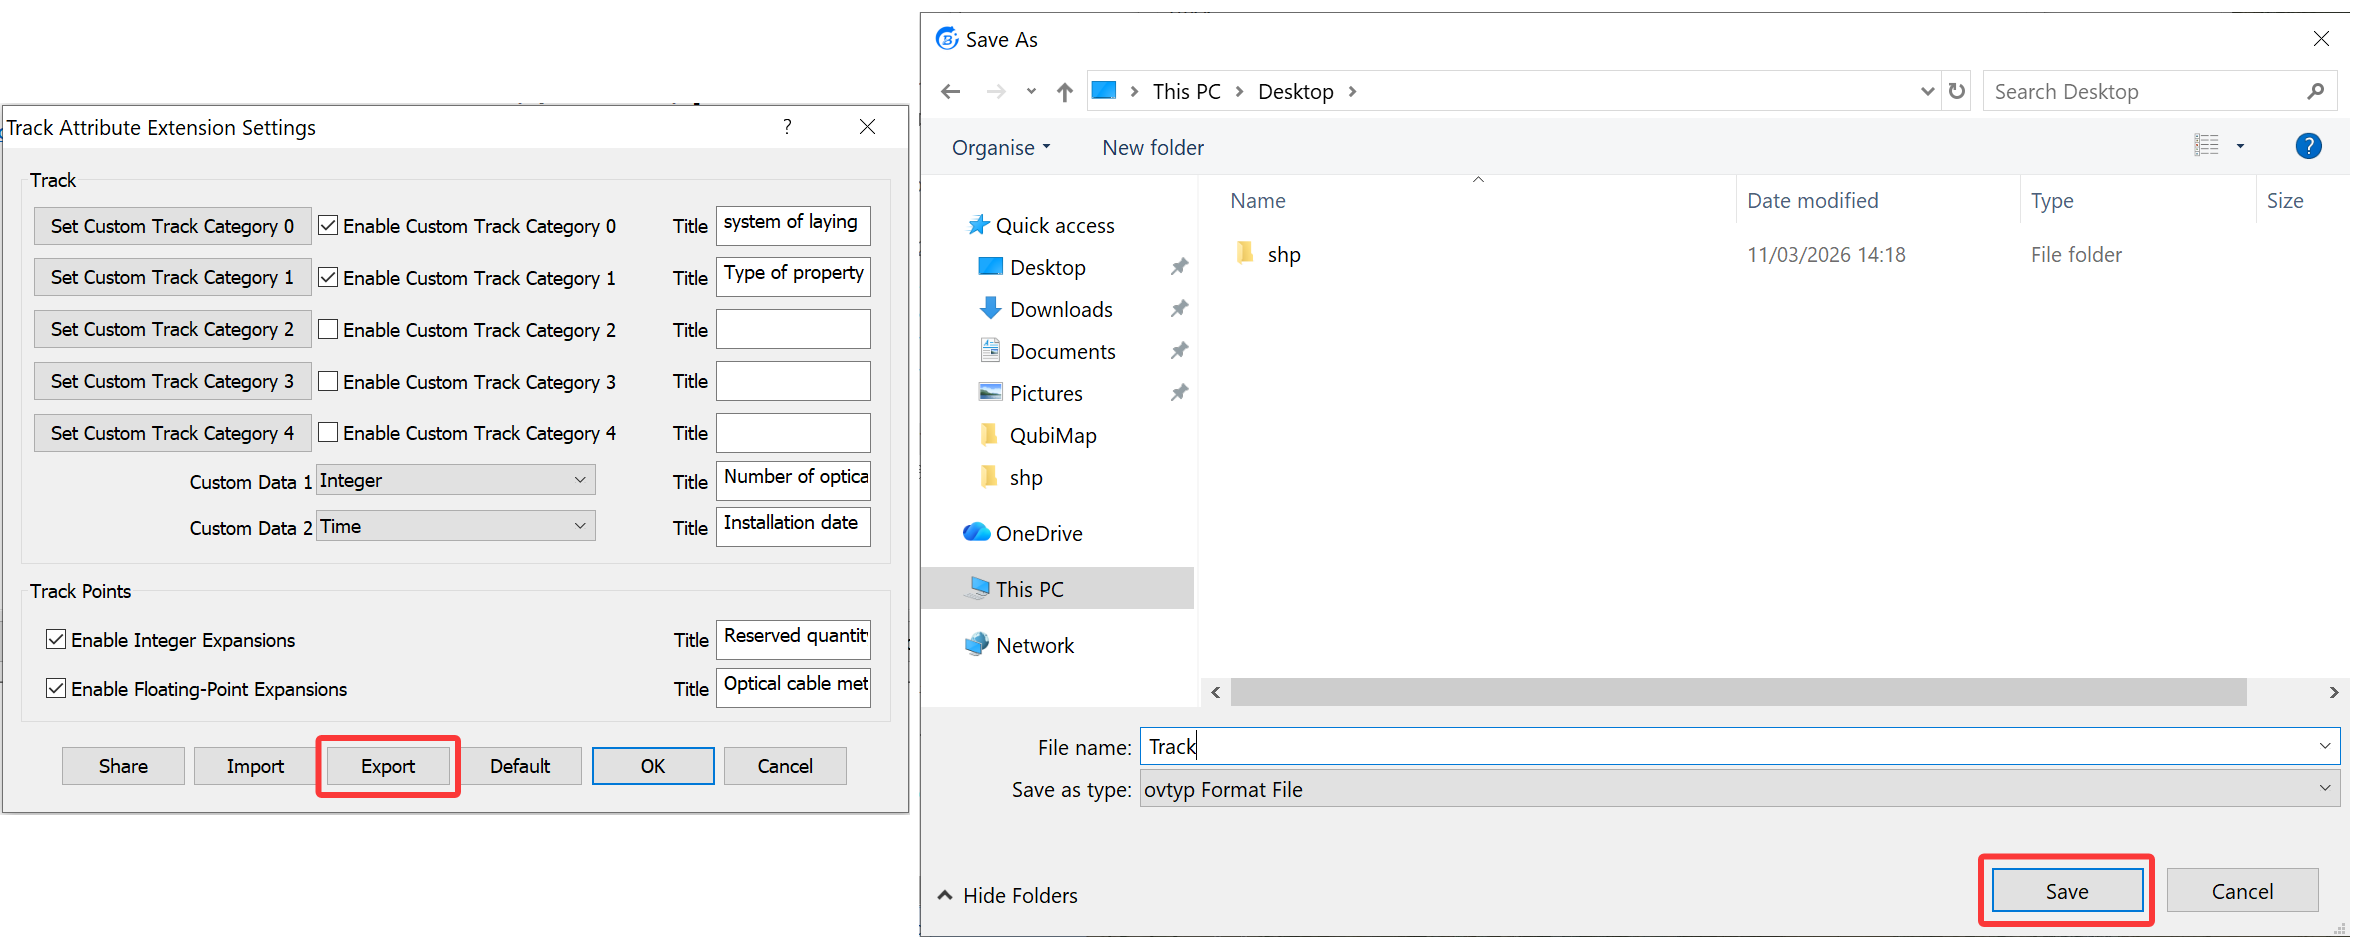
In the [Track Attribute Extension Settings] dialog box, click [Export]. In the dialog box that appears, select a storage location, specify a file name, and then click [Save]. This way, the current track attribute extension settings are saved to your local disk.

2abf8533-c7c4-4daf-b00b-f3e2a5900838 copy

How to import track attribute extension settings

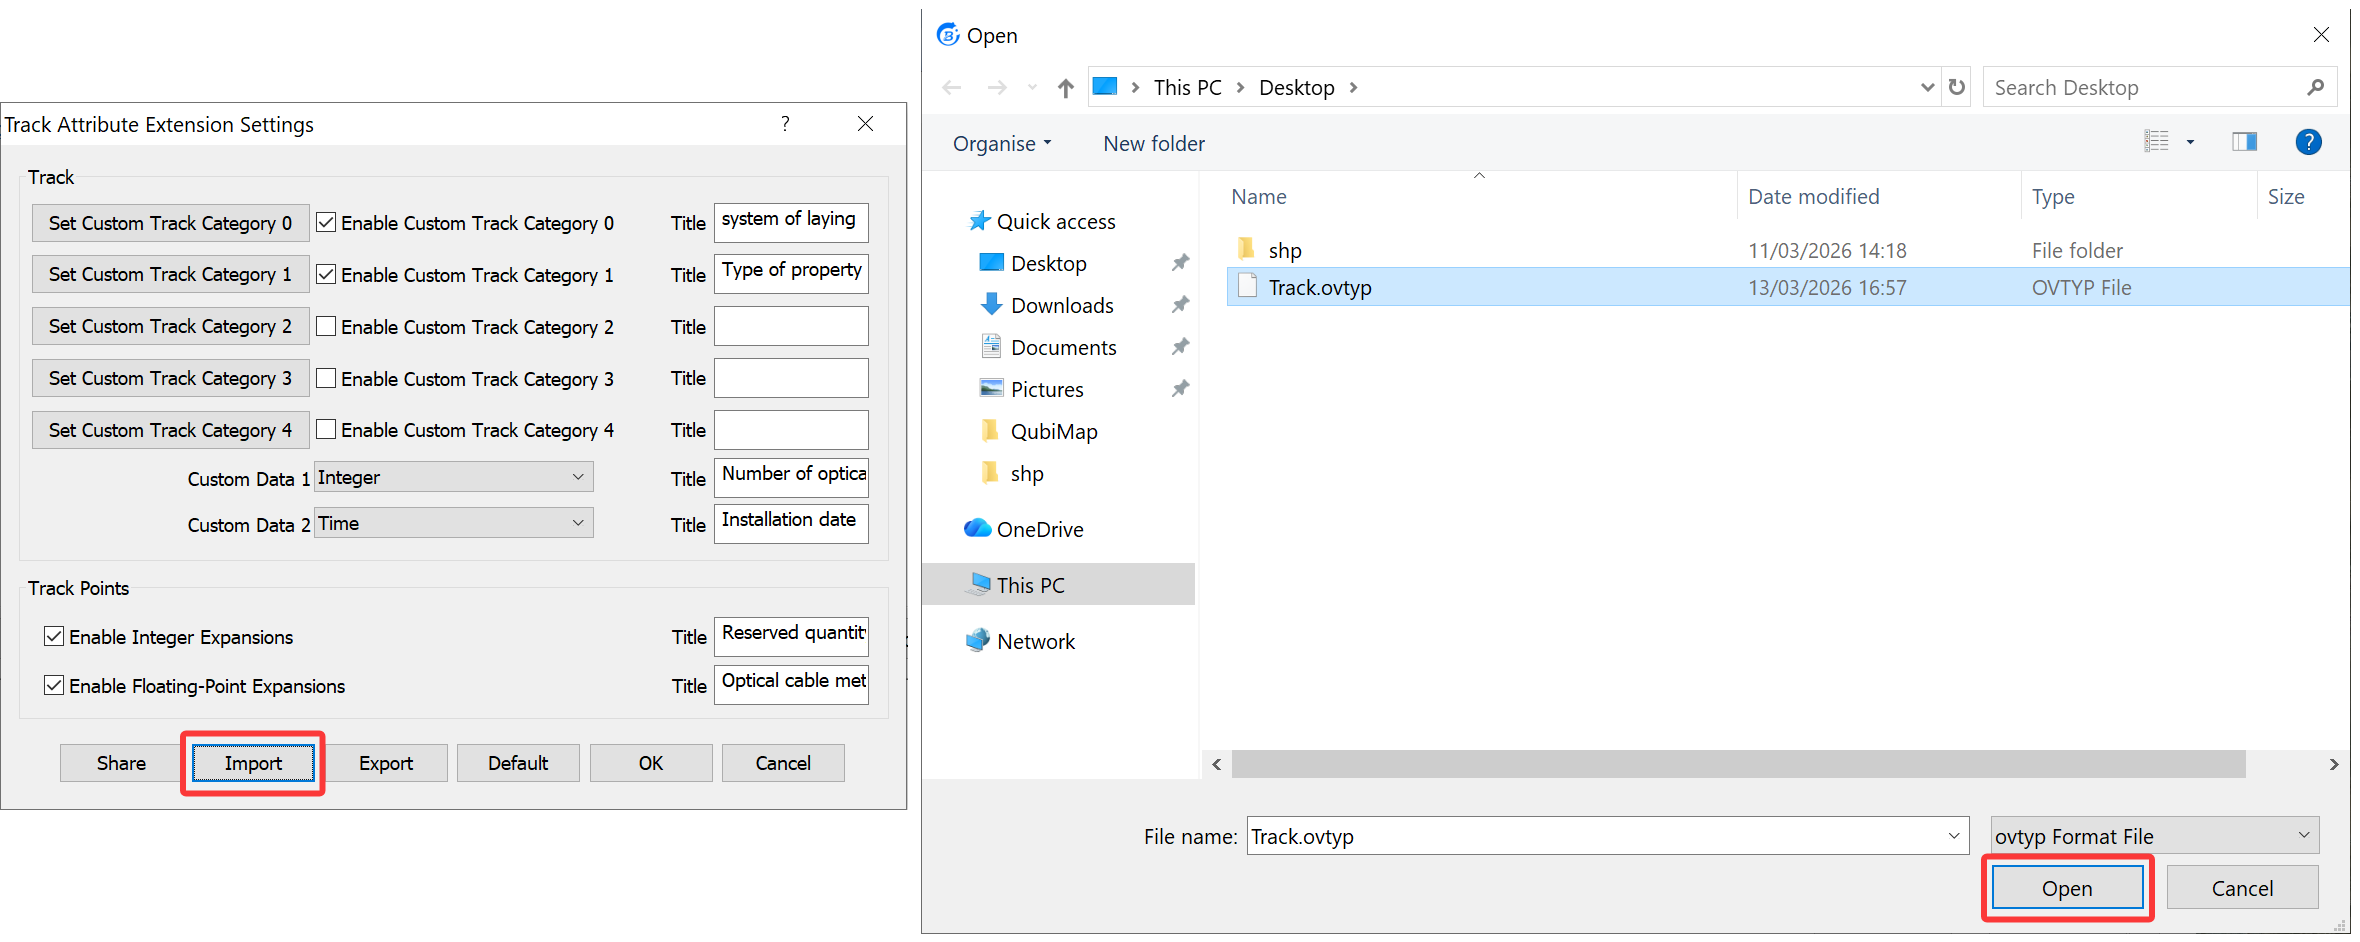
(1) Click [Import]. In the file selection dialog box, select the required configuration file and click [Open].

d6 copy

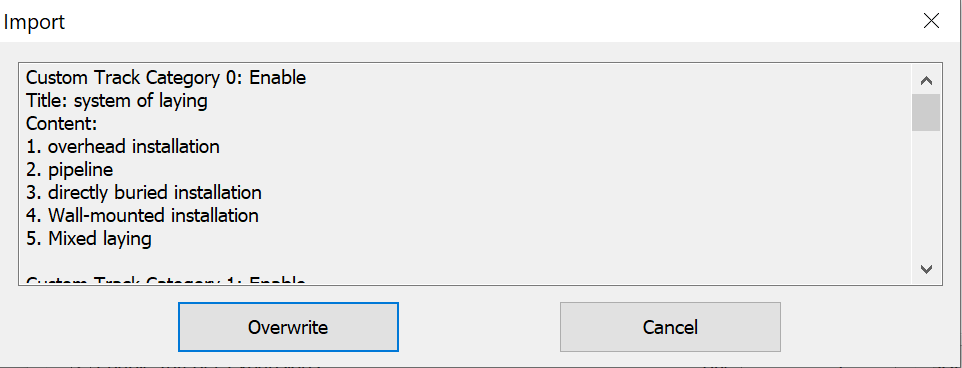
(2) In the dialog box that shows the information to be imported, click [Overwrite] to overwrite the local settings.

image-20260313171438116

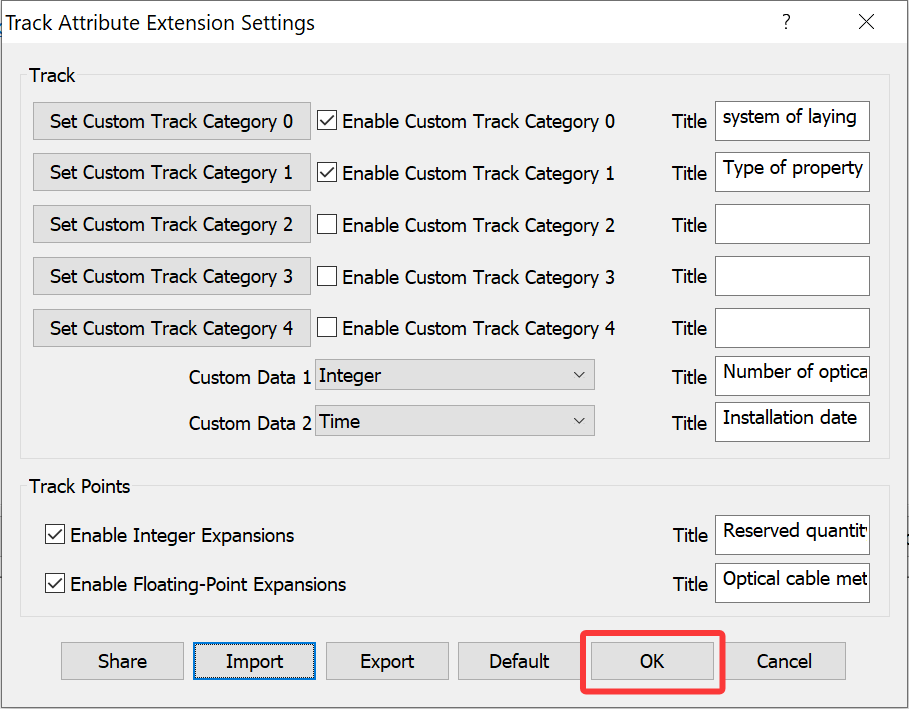
(3) Click [OK] to make the settings take effect. The [Track Attribute Extension Settings] dialog box is also closed.

image-20260313171540704

How to export track attribute details from a folder as a CSV table

(1) Select the folder where the required tracks are located, right-click the folder and select [Attributes] to go to the [Folder Settings] dialog box. In this dialog box, click the [Details] button.

image-20260313172817919

(2) In the folder details list, double-click the [Track] row.

image-20260313172904264

(3) In the track details dialog box, click [Export CSV].

image-20260313173158799

(4) In the track export configuration dialog box, set the file path and select the required output items. You can adjust the order of any item if necessary. Then, click [OK].

image-20260316151356888

(5) You can open the saved CSV file with Excel for further editing, as shown in the following figure:

image-20260316154023773

The basic operations for tracks include: drag track points, drag the entire track, add and delete track points, and split and merge tracks. To perform these operations, you need to make sure that the tracks are in editable mode.

This article describes how to perform these basic operations on tracks by using the PC and mobile versions.

1. PC

On the map, find the required track, click on the track, and then click the C978CEE0-1ABB-45dc-A8A8-7D879B9897E3 button to go to the [Track Settings] dialog box.
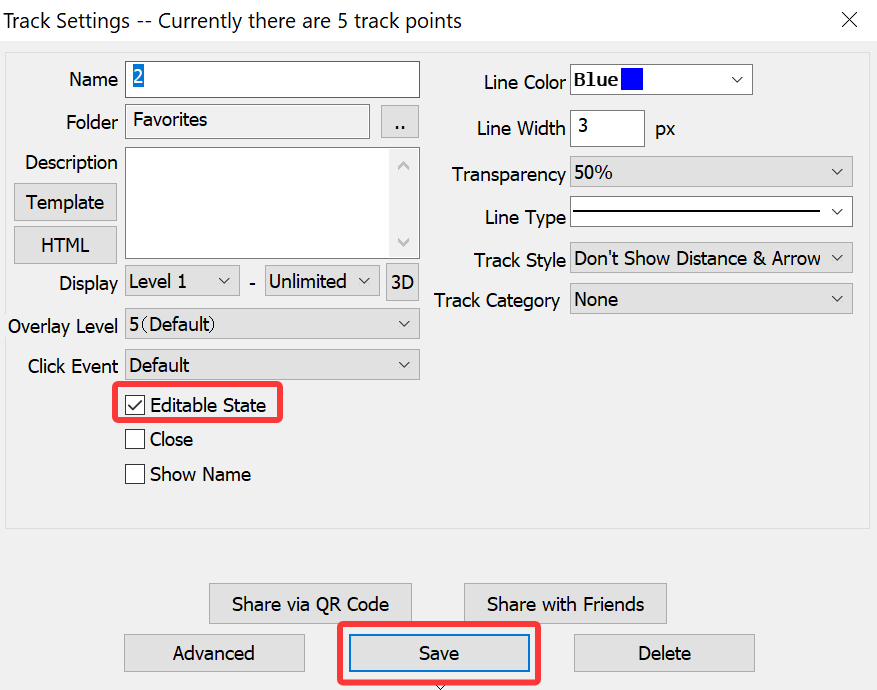
Select [Editable State], and then click [Save].

image-20260312154134698

When you move the mouse cursor (pointer) to different positions on the track, the pointer changes to different styles, and the prompt bar in the lower left corner of QubiMap demonstrates the supported operations on the current position and specific operation methods.

Drag a track point: Move the mouse pointer to a track point (node). The pointer changes to img. Hold down the left mouse button to drag the node.

Move the entire track: Hold down the Shift key and move the mouse pointer to any track position. The pointer changes to img. Hold down the left mouse button to drag the entire track.

Add a track point: Hold down the Ctrl key and move the mouse pointer to the desired location on the track. The pointer changes to img. Click the left mouse button to add a node.

Delete a track point: Hold down the Ctrl key and move the mouse pointer to the required track node. The pointer changes to img. Click the left mouse button to delete the node.

Split a track:

(1) Hold down the Alt key and move the mouse pointer to the node where you want to split the track. The mouse pointer changes toimg. Click the left mouse button, and the following dialog box appears:

image-20260414143619062

(2) Click [OK]. The original track is split into two tracks.

Note: A track consisting of only two track points cannot be split.

Merge tracks:

(1) Hold down the Alt key, move the mouse pointer to the endpoint of a track, and click the left mouse button. The mouse pointer changes to img. Hold down the left mouse button to drag the endpoint of this track to the endpoint of another track. The two endpoints are automatically snapped. Release the left mouse button, and the following dialog box appears:
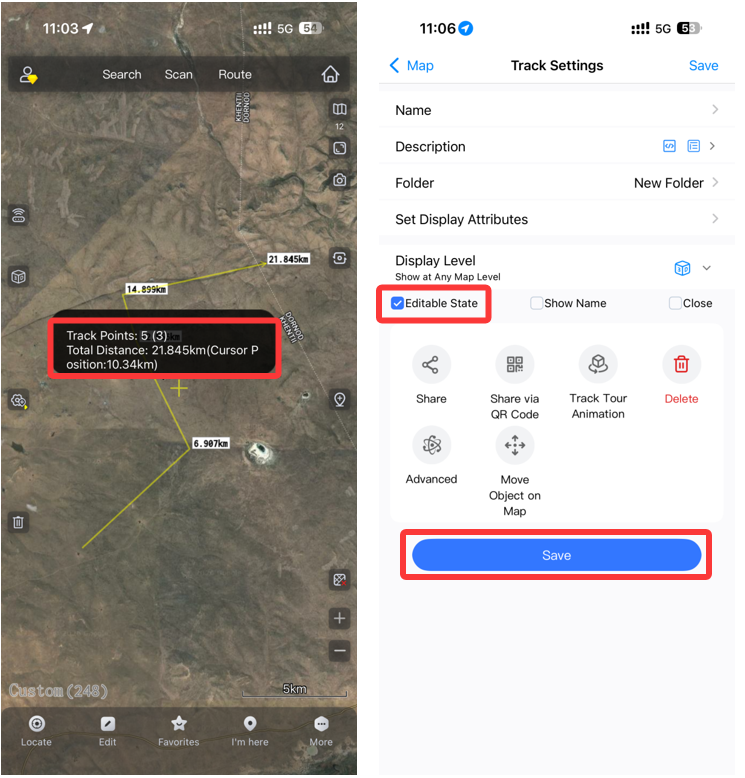
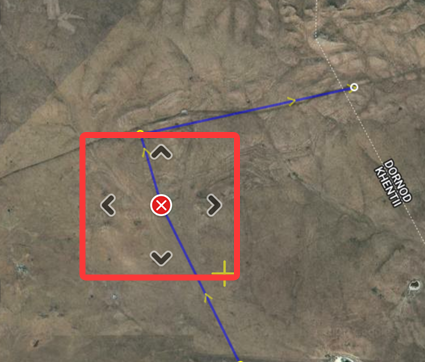
image-20260414144941649

(2) Click [OK]. The two tracks are merged into one track.

Note: You can only use track endpoints for merging. Any track points in the middle cannot be used for this operation.

2. Mobile device

On the map, find the required track, tap on the track, and then tap on the floating window that appears.

In the [Track Settings] dialog box, select [Editable State], and then click [Save].

image-20260507114905115

Drag a track point: Tap a track point you want to move, and then hold down the center point of the operation panel to drag. You can also use the up, down, left, and right direction buttons to manipulate.

image-20260508102037608

Add a track point: Tap where you want to add a track node on the track, and then tap the button in the floating window to add a node.
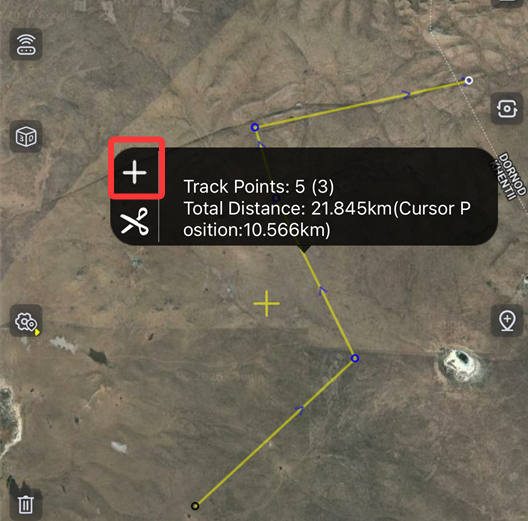
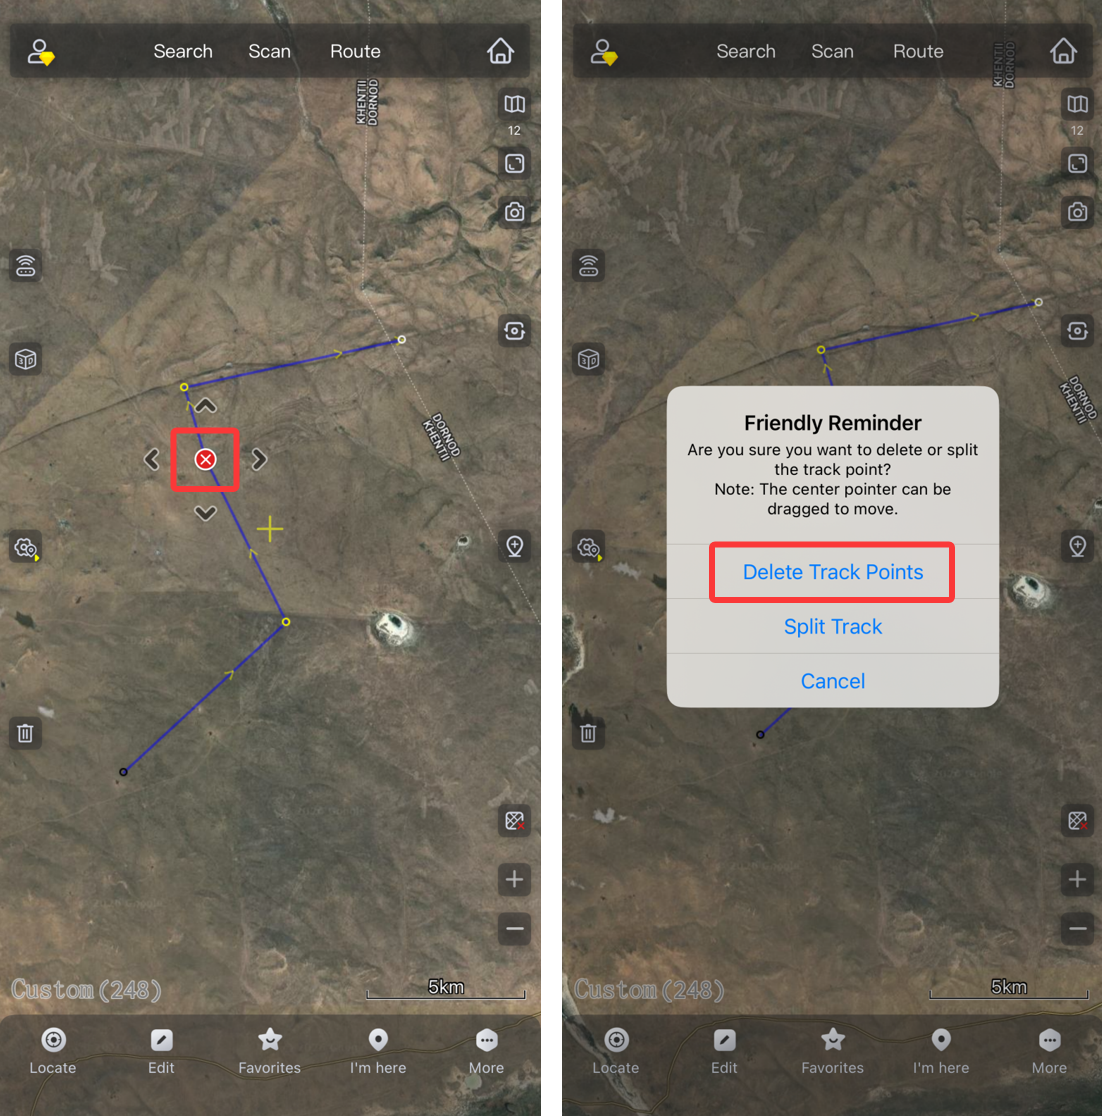
image-20260508102158254

Delete a track point: Tap the track point you want to delete, then tap the center point of the operation panel to delete the track point.

image-20260508103735169

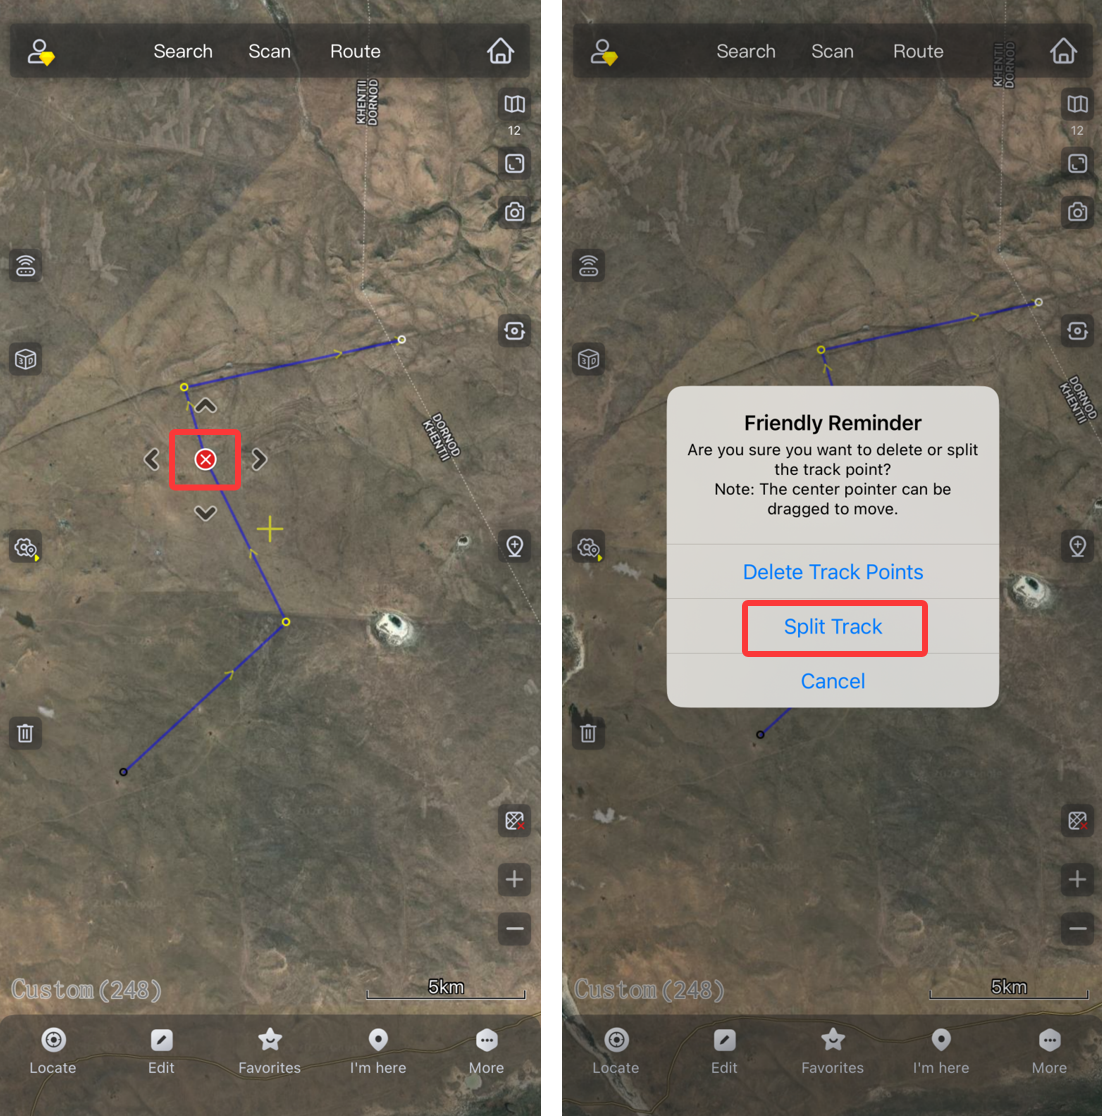
Split a track: Tap the track point by which you want to split the track, and then tap the center point of the operation panel to split.

Note: A track consisting of only two track points cannot be split.

image-20260508103825915

Merge tracks:

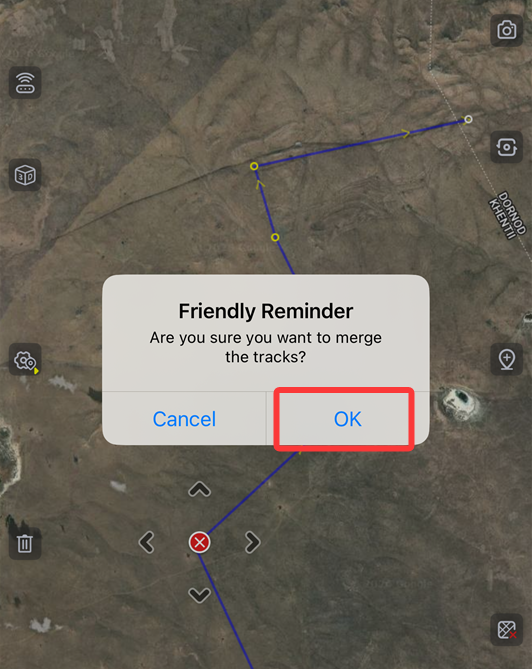
(1) Tap the endpoint of the track, hold down the center point of the operation panel to drag it to the endpoint of another track. After the two endpoints are automatically snapped together, the following dialog box appears:

image-20260508103931936

(2) Click [OK]. The two tracks are merged into one track.

Note: You can only use track endpoints for merging. Any track points in the middle cannot be used for this operation.

For more information about advanced track features, see Help on the QubiMap official website.

Get ready to try QubiMap

Sign up for free trail and get started with QubiMap

Try Now