作者: 刘, 子豪

QubiMap supports loading large-scale 3D models at high speeds, delivering exceptional rendering performance while maintaining low memory consumption. It provides optimal experience for BIM designers, constructors, and O&M personnel.

Currently, QubiMap supports model formats such as 3DS, OBJ, DAE, and SKP, as well as oblique photography formats like OSGB, SLPK, and 3DTiles. This article describes how to import 3D models. In this example, a SKP model file is used.

1. Import a 3D model

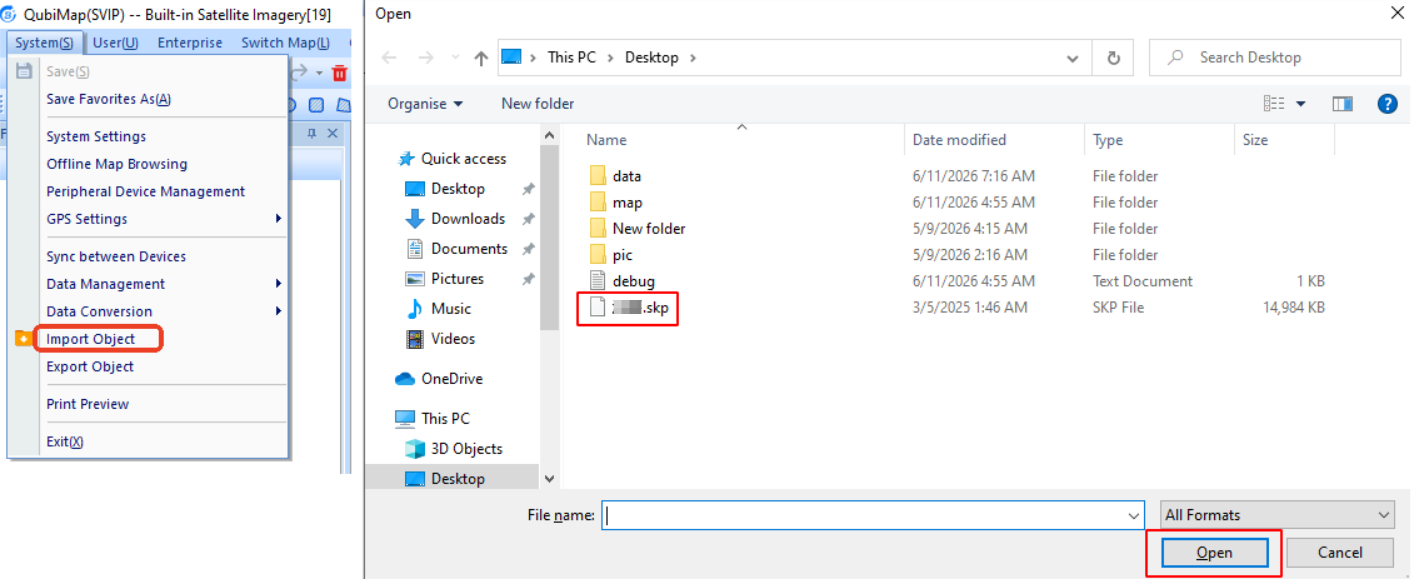
Open QubiMap, click the [3D] button to enter 3D mode, and then choose [System] > [Import Object]. Navigate to the directory where the file is stored, select the model file, and click [Open].

image-20260622152048290

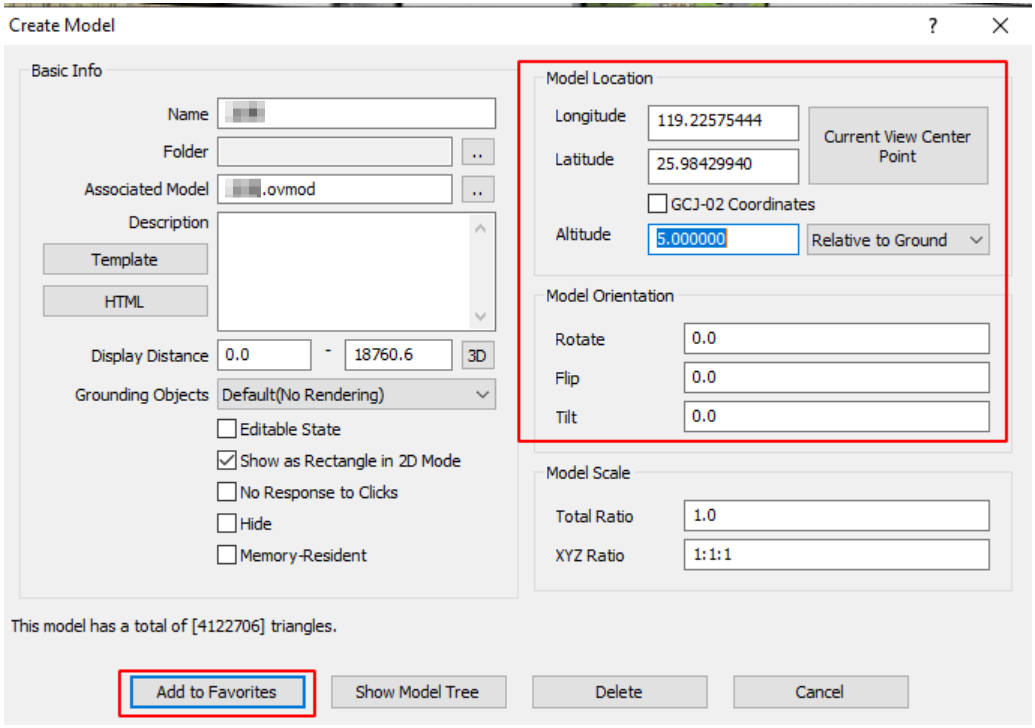
After the loading process is completed, click [Add to Favorites]. You can also edit the latitude, longitude, altitude, and orientation information in the current dialog box to import the model to the required location.

image-20260622152129979

If the import fails, please install the VC++ Redist library and try again. For more information, see the help document “How to install the VC++ Redist library”.

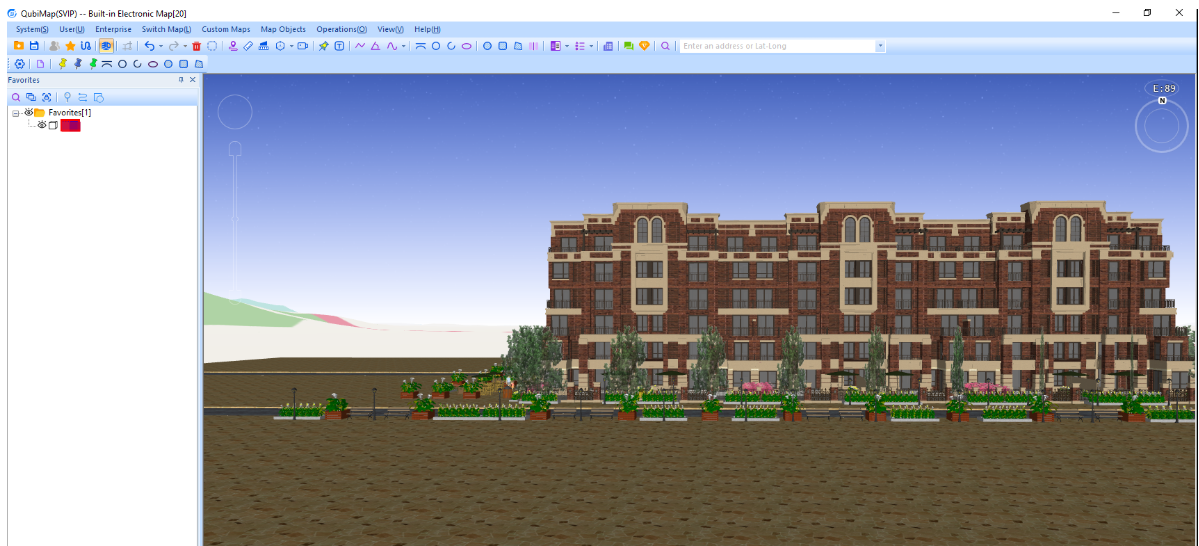
After the model is imported, double-click this model in your favorites to go to the corresponding location.

image-20260622152230022

2. View the model

You can view a 3D model by using the following shortcut keys:

☆ Middle mouse button: Adjust the pitch and rotation angles

☆ Shift + Up arrow: Decrease the pitch angle

☆ Shift + Down arrow: Increase the pitch angle

☆ Shift + Left arrow: Rotate counterclockwise

☆ Shift + Right arrow: Rotate clockwise

☆ Scrolling of the mouse wheel: Adjust the eye altitude

You can also press the F10 key to enter model browsing mode. In this mode, the following shortcut keys are available:

☆ Any arrow key or ASDWQE key: Move the field of view

☆ X key or Spacebar: Adjust the eye altitude

☆ Right mouse button: Adjust the pitch angle and direction

☆ Z or C key: Adjust the forwarding speed

☆ T key: Enable collision detection

1. Supported GPS devices

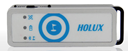
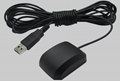
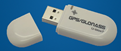
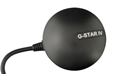
You can connect GPS devices that transmit data via a serial port and support the NMEA0183 protocol to QubiMap. The following table lists the commonly used GPS device models:

Brand Model Port
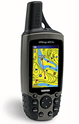
Garmin 60CSx USB img
HOLUX RCV-3000 USB + Bluetooth img
HOLUX M-1200E USB + Bluetooth img
V.KEL VK-162 USB img
V.KEL VK-172 USB img
Globalsat BU-353 USB img
UBLOX UB-353 USB img
2. Add a GPS device to QubiMap

(1) Connect your GPS device to the computer by using a USB cable and install the GPS device driver to generate a virtual serial port. If the GPS device supports Bluetooth and can transmit NMEA0183 data in real time, you can also use Bluetooth for connection.

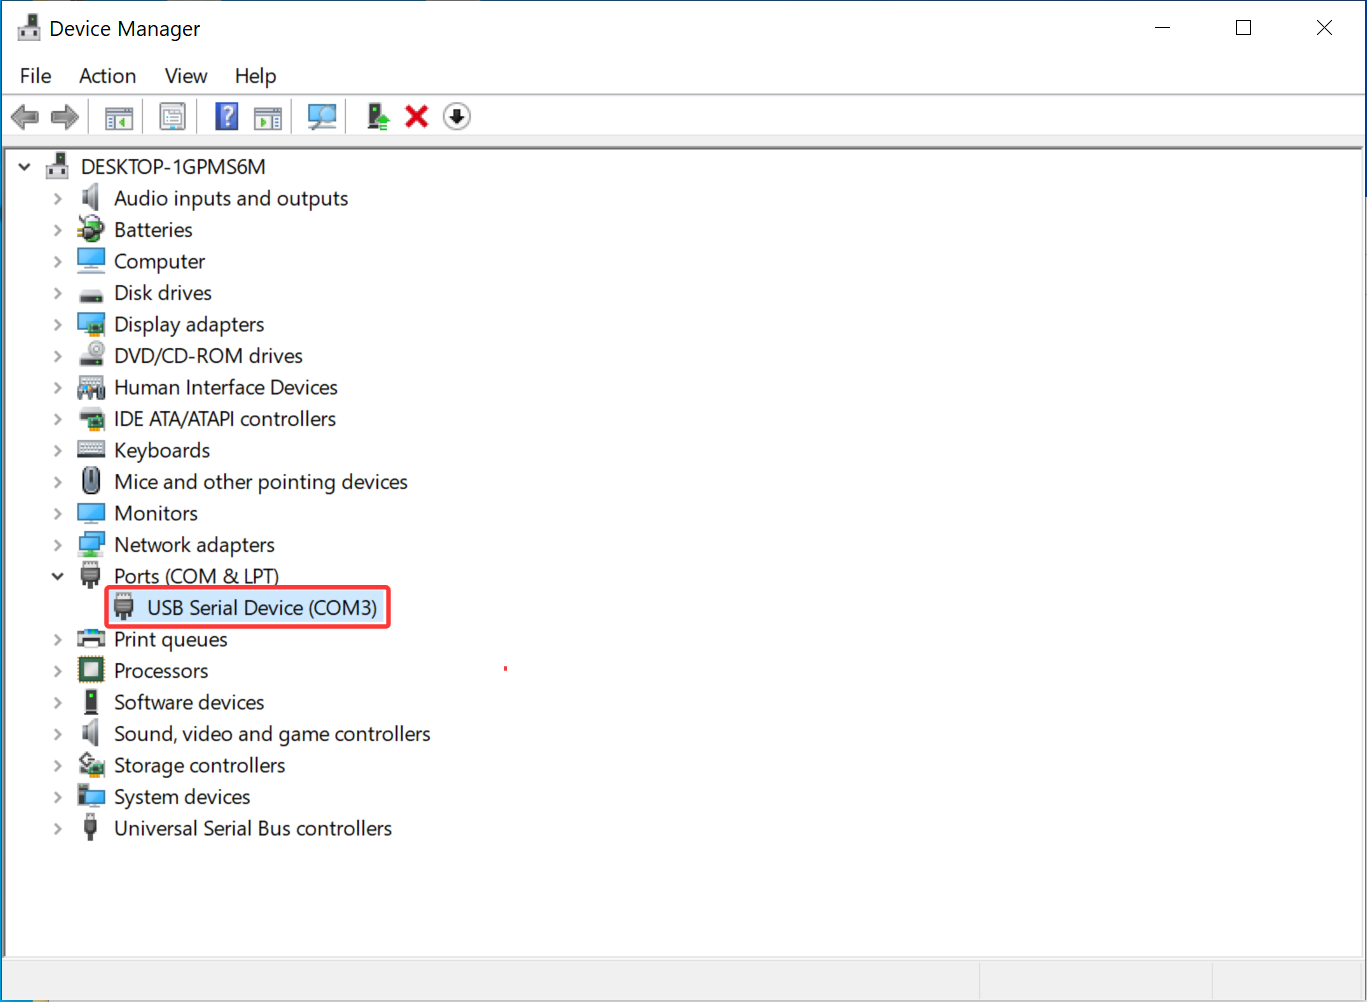
(2) Right-click [This PC], and select [Manage]. In the window that appears, click [Device Manager] → [Ports] to view the virtual serial port number, as shown in the following figure:

image-20260624150822085

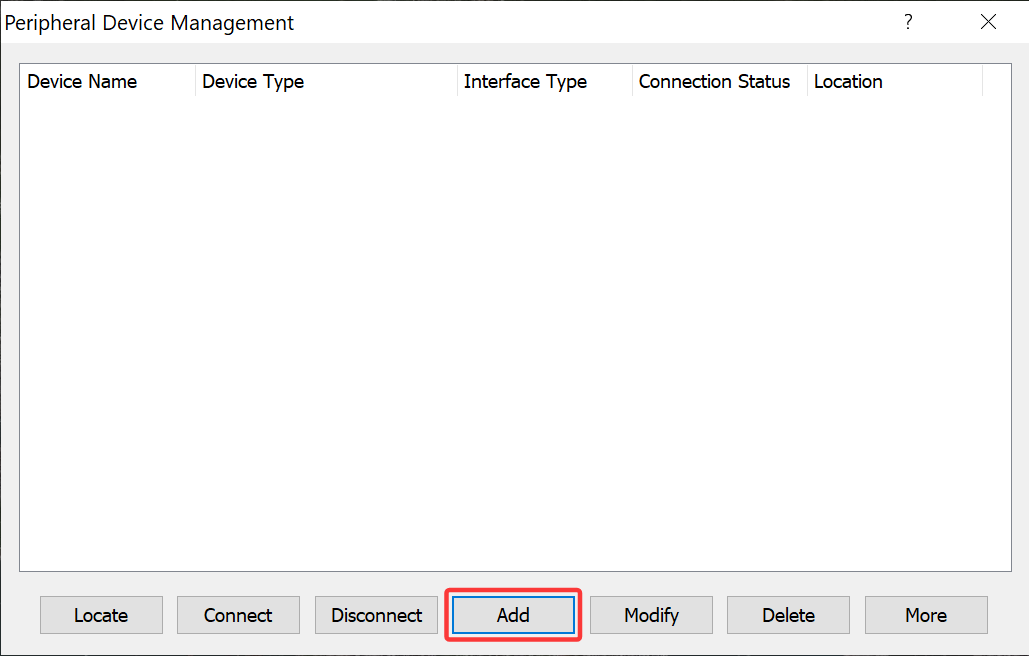
(3) Open the QubiMap client on your PC, and choose [System] > [Peripheral Device Management]. In the dialog box that appears, click [Add], and select [Add Serial Device] or [Add Bluetooth BLE Device] based on your needs. In this example, [Add Serial Device] is selected.

image-20260624150950883

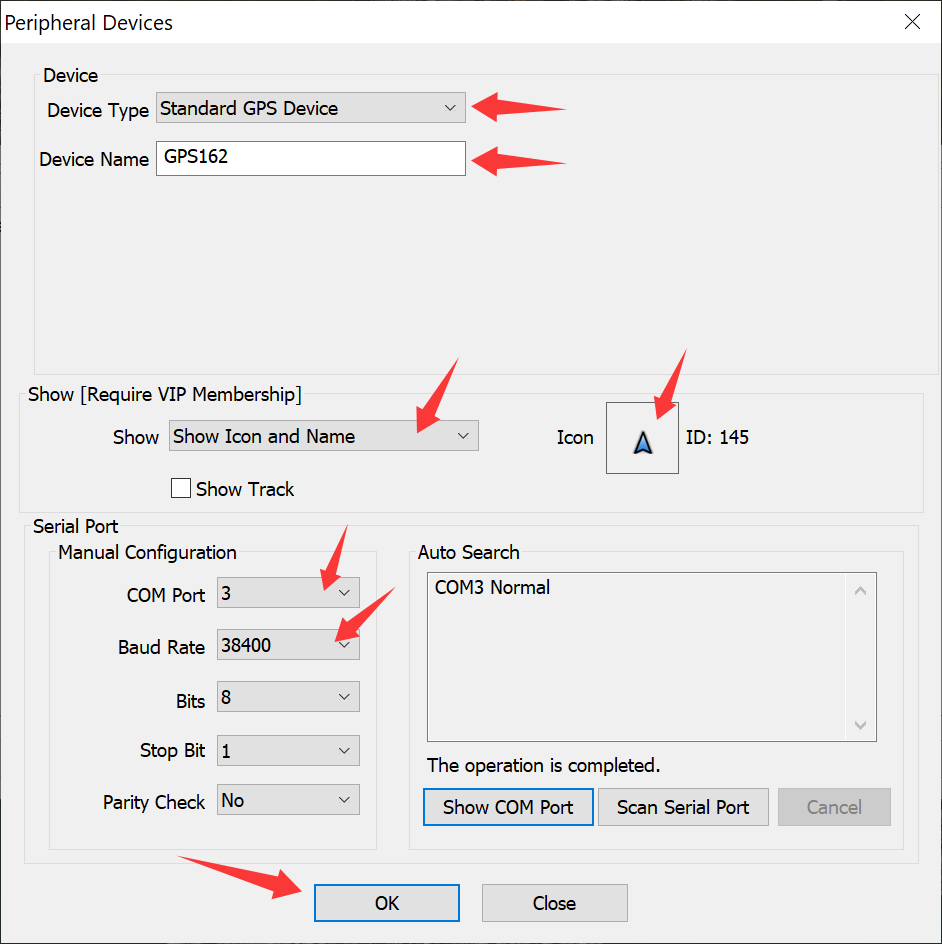
(4) In the dialog box that appears, set the parameters as needed, and click [OK].

COM Port: Select the port number of the connected GPS device. The port number may change if the USB port is changed.

Baud Rate: Set this value based on the actual baud rate of the GPS device. The commonly used baud rate is 38400.

image-20260624152431072

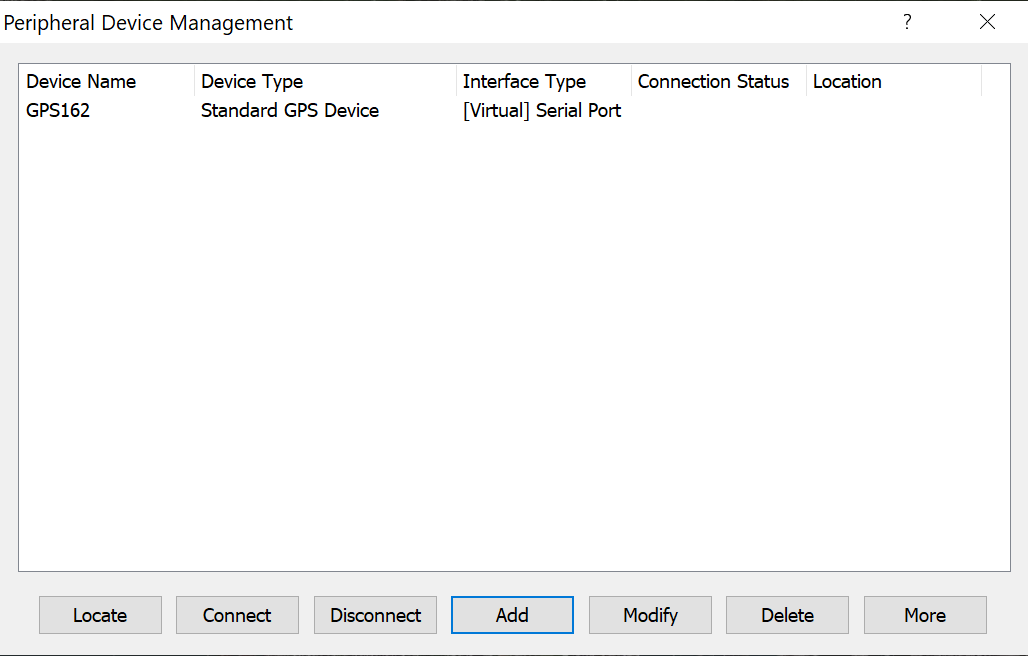
(5) The GPS device is displayed in the peripheral device list, as shown in the following figure:

image-20260624152909162

3. Use GPS features

After the GPS device is connected to QubiMap, you can use the following GPS features:

Enable the GPS device: Choose [System] > [GPS Settings] > [Enable GPS].

image-20260624153433030

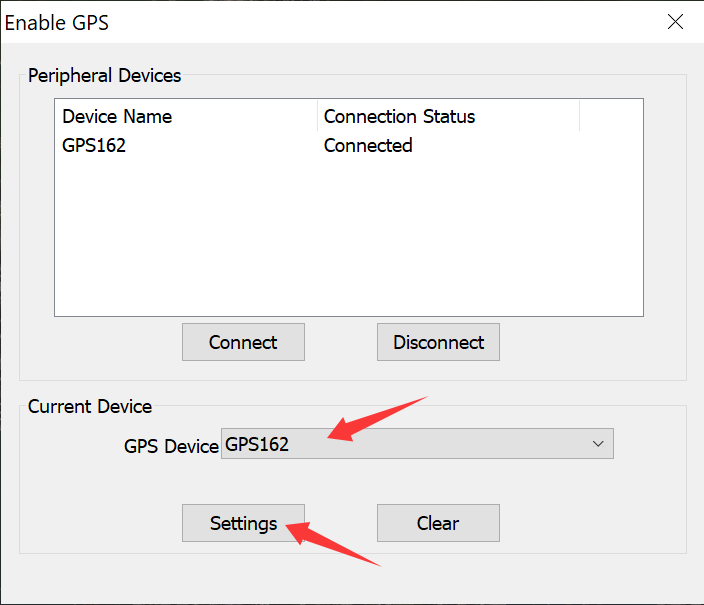
In the [Enable GPS] dialog box, select your GPS device to enable it. Then, you can use the GPS device for location sharing, map following, and track recording.

Locate the GPS device: Choose [System] > [GPS Settings] > [Locate GPS Device]. The connected GPS device is displayed on the map.

Follow the GPS device: Choose [System] > [GPS Settings] > [Follow GPS Device]. When you follow the GPS device, it is always displayed at the map center.

Record tracks: Choose [System] > [GPS Settings] > [Start Track Recording]. To stop track recording, choose [System] > [GPS Settings] > [Stop Track Recording]. After you record a track of the GPS device, the track is displayed on the map as a temporary object. You can double-click on it to go to the [Track Settings] dialog box, and add it to your favorites.

Add your locations to the favorites: Choose [System] > [GPS Settings] > [Add My Location to Favorites]. The current location of the GPS device is added to your favorites as a placemark.

QubiMap provides various advanced features of tracks. This article describes how to use these track features.

Click on a track on the map. In the [Track Settings] dialog box that appears, click [Advanced]. In the [Advanced Track Features] dialog box, you can select the required feature from the list.
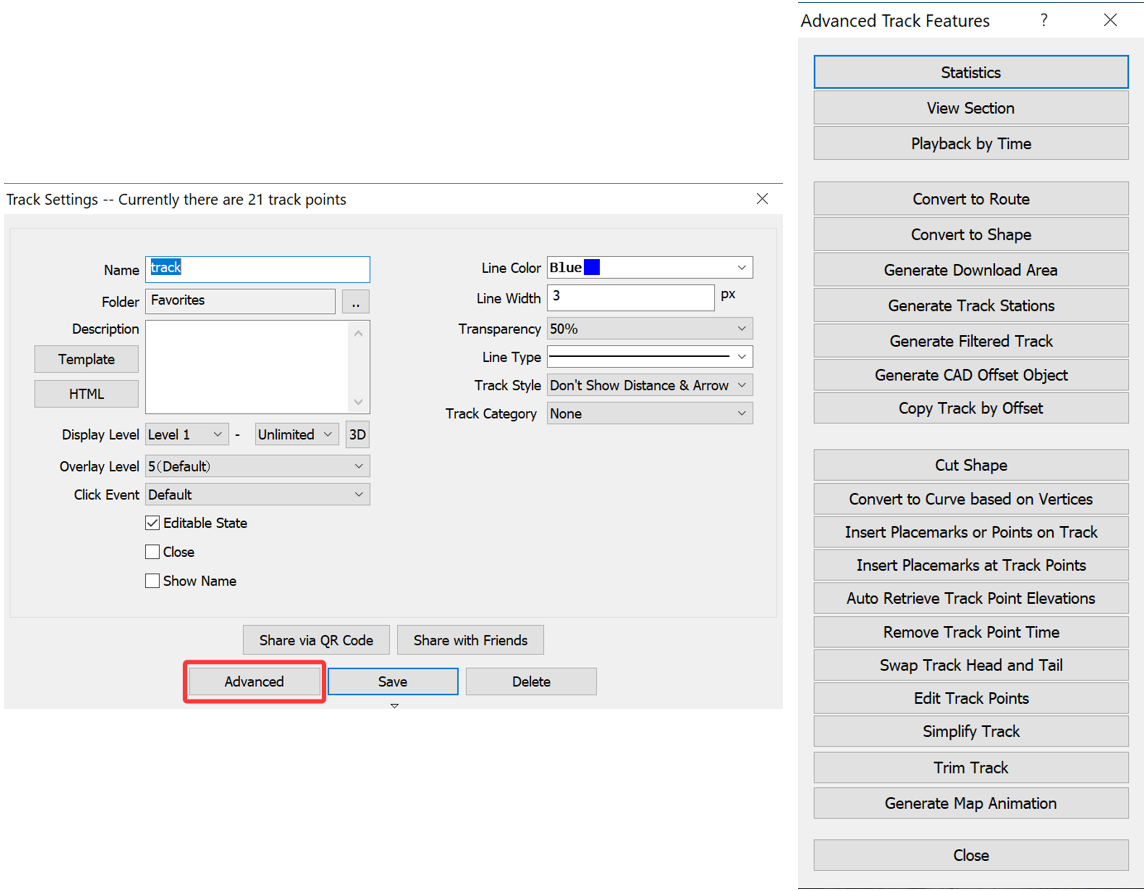
image-20260617104251464

1) Statistics: View the track details, as shown in the following figure:
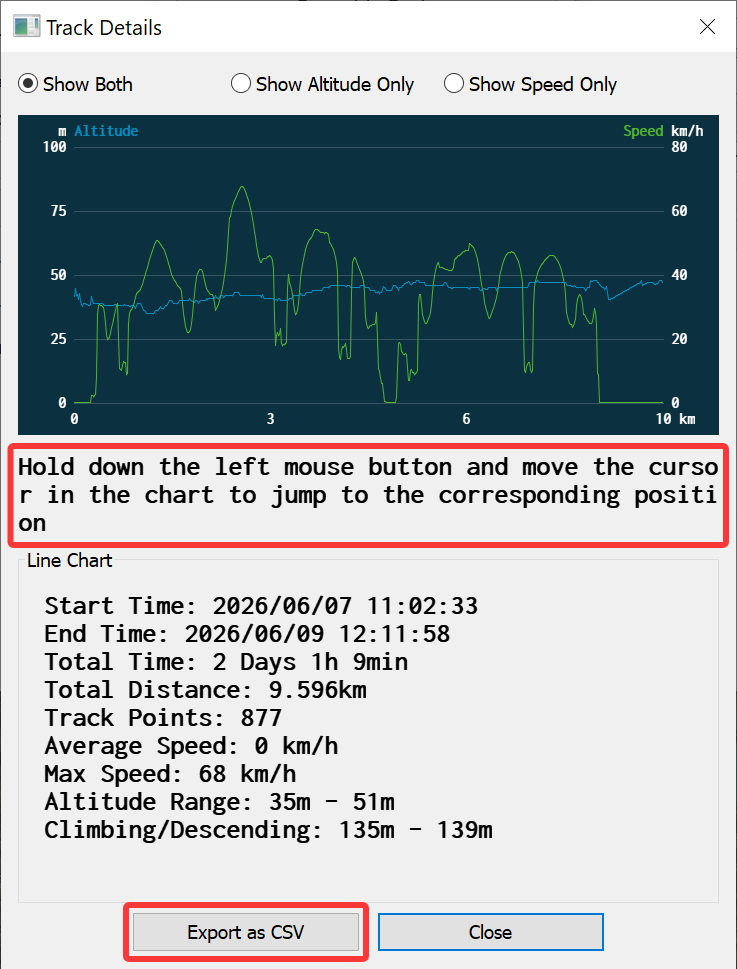
image-20260617145347505

You can click [Export as CSV] to export data such as the latitude, longitude, altitude, elevation, distance, and time for each track point to a CSV file, which can be opened in Excel for further processing.

image-20260626145311698

Note:

①The time information is only available for recorded tracks.

②These custom parameters are available when you enable custom track categories.

2) View Section
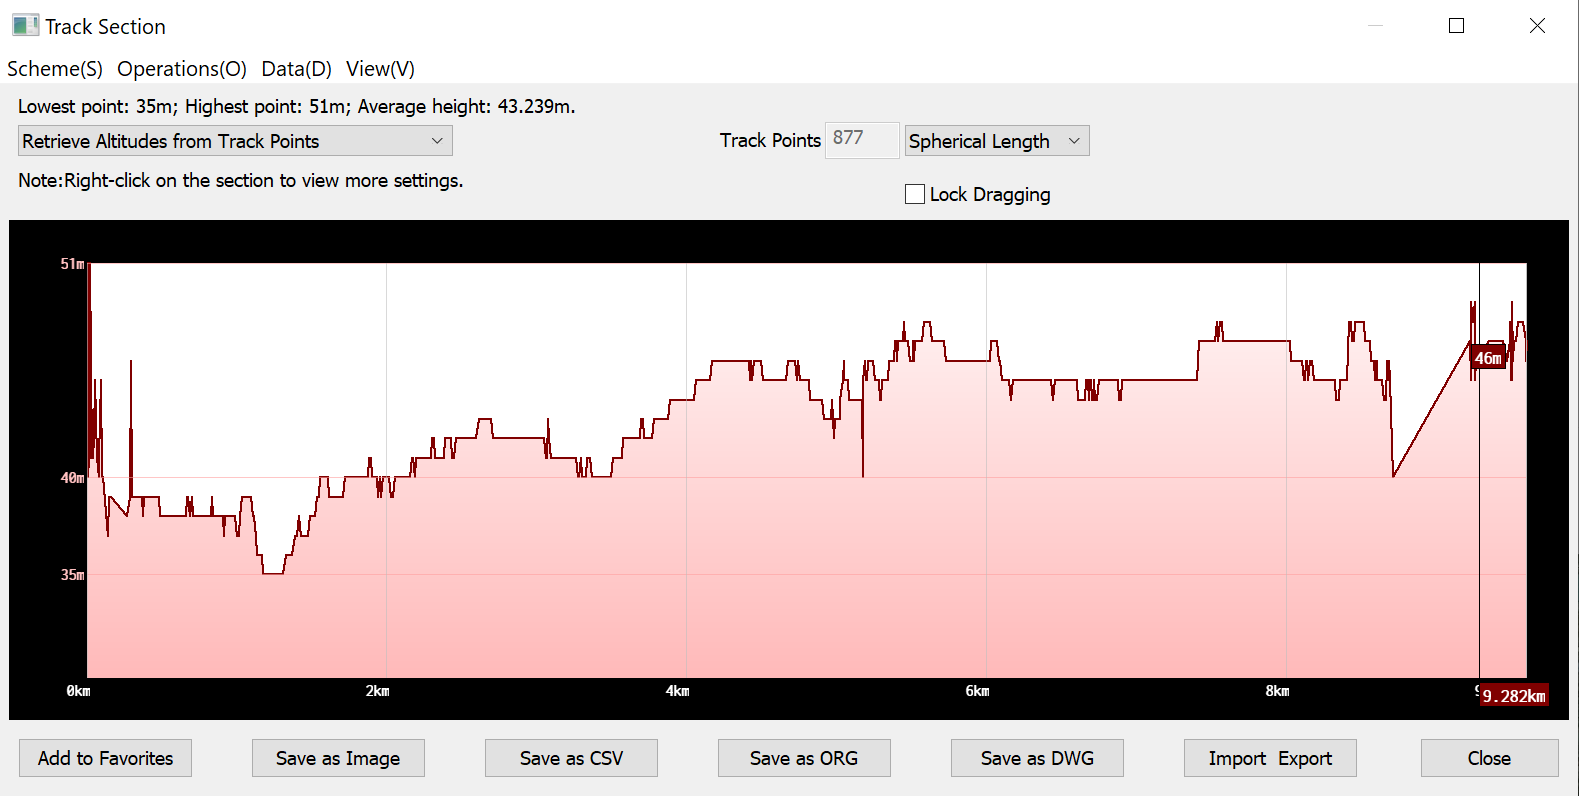
image-20260617155513405

Add to Favorites: Add the track to the favorites with the naming format of Section({Time}).

Save as Image: Save the current sectional view as an image.

Save as CSV: Generate 200 equidistant track points virtually and export the track point information to a CSV file, as shown in the following figure:
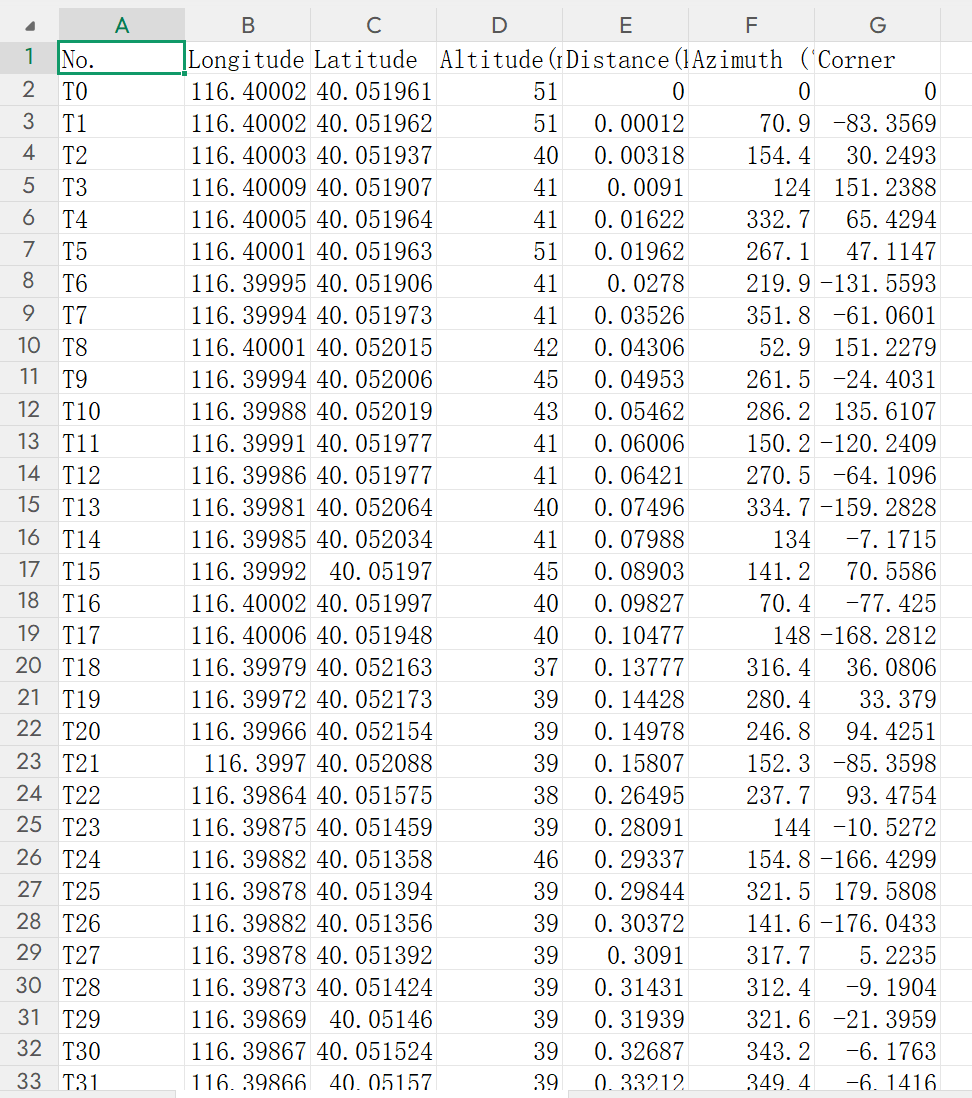
image-20260617155645687

If you need to export actual track point data, please use the [Export as CSV] feature in [Statistics].

Save as ORG: Save the current sectional view in ORG format.

Save as DWG: Save the current sectional view in DWG format. You must first right-click on the section to switch to zoom mode.

Import/Export: Import survey stakes and survey points in CSV format, and LAS data; Export survey stakes in CSV format.

3) Playback by Time: Play the track by time. You can set the speed and click [Play] to start track playback, as shown in the following figure:
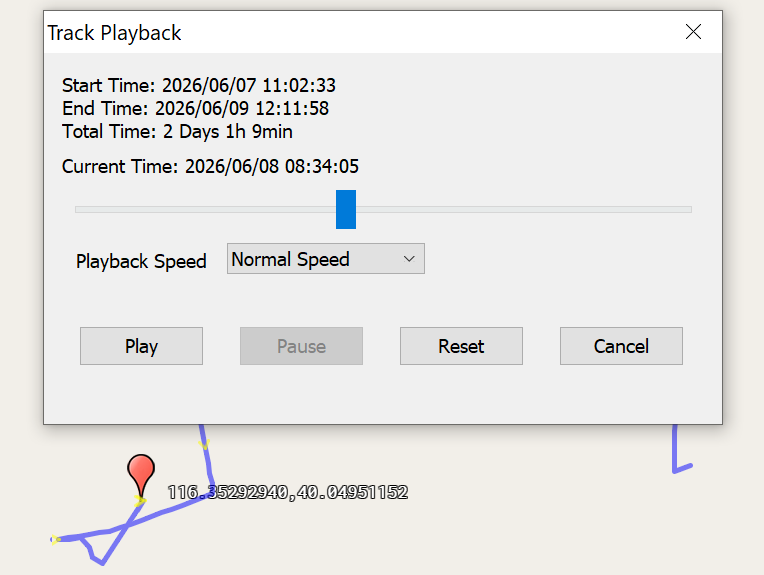
image-20260617160008693

4) Convert to Route: Generate a route from the current track. You can go to the [Navigation Route Settings] dialog box and perform the required operations.
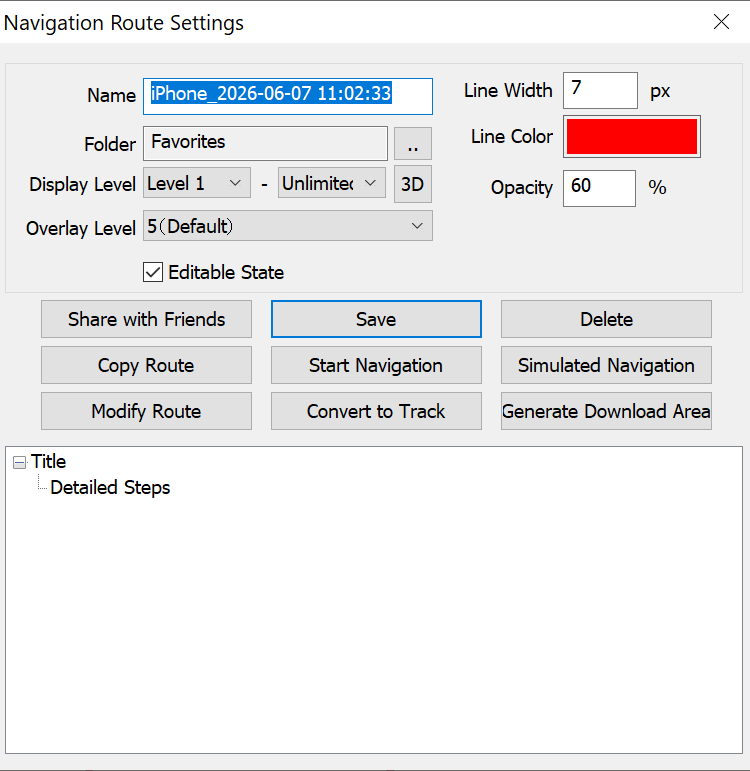
image-20260617160117388

QubiMap provides the simulated navigation feature. If a GPS device is connected to your computer, you can also start navigation directly.

5) Convert to Shape: Generate a closed shape from the current track. The starting and end points of the track are connected to form the outline of the shape.
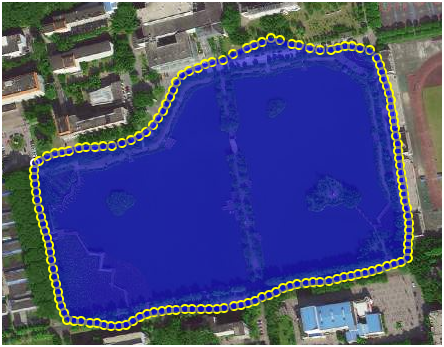
img

You can go to the [Shape Settings] dialog box and click [Advanced] → [Details] to view the shape details. This feature is often used to calculate land area.
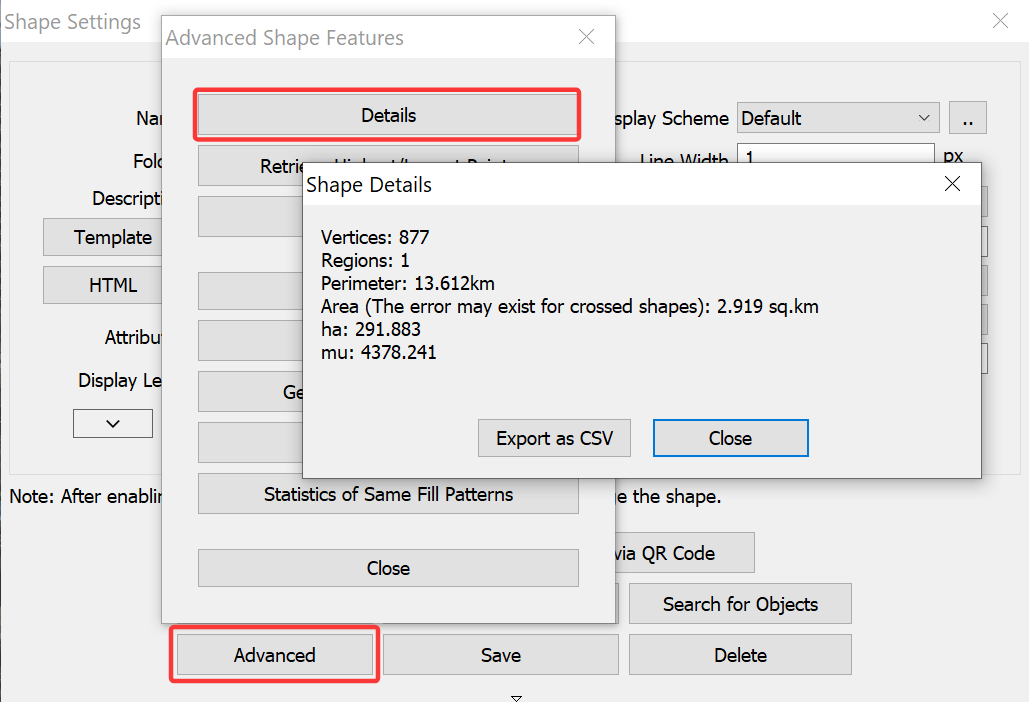
image-20260617164321838

6) Generate Download Area: Generate a shape area for download. You can set the parameters in the [Area Auto-Generation Settings] dialog box.
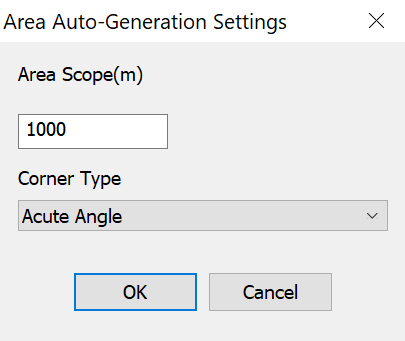
image-20260617164453216

Set the [Area Scope] and [Corner Type] parameters, and click [OK].
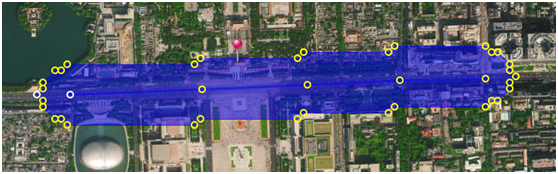
img

This feature is used to download map data within a specified range along a track, which can reduce unnecessary data.

7) Generate Track Stations: Generate construction stations (mile markers) on a track. Set the parameters as needed, and click [OK].
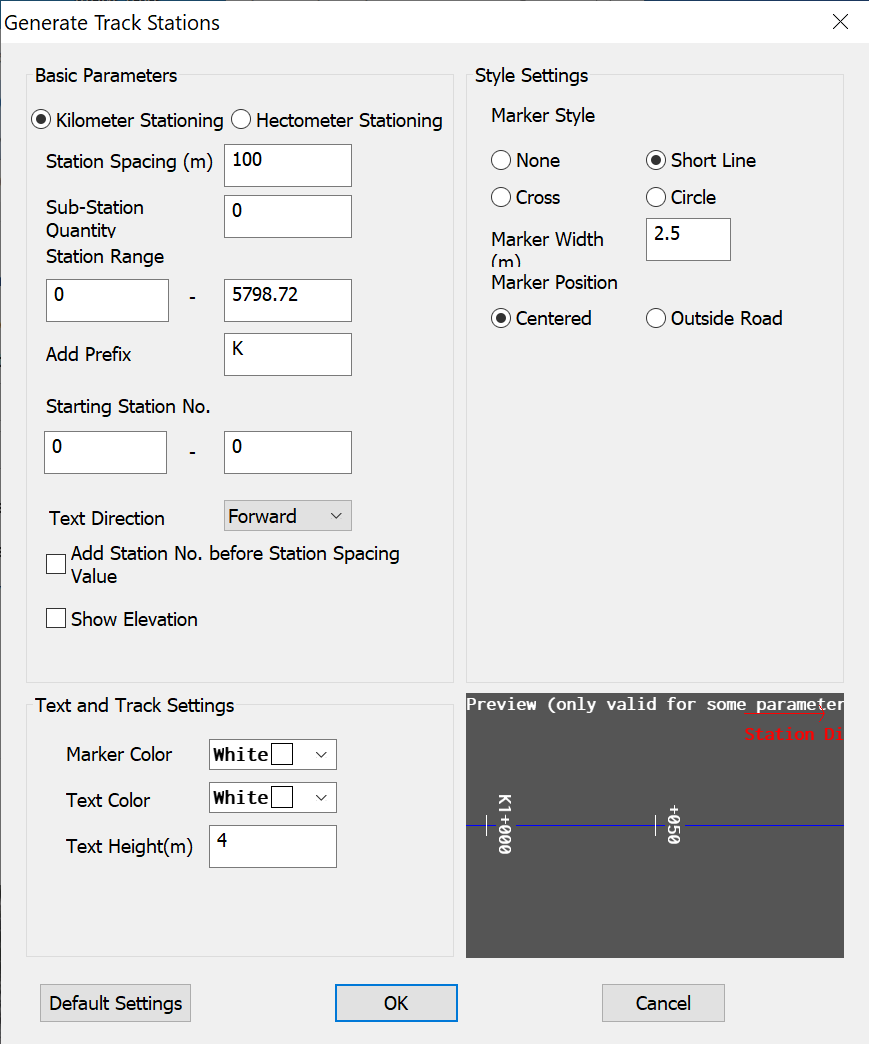
image-20260618094216263

The generated stations (mile markers) are added to your favorites and displayed on the map.
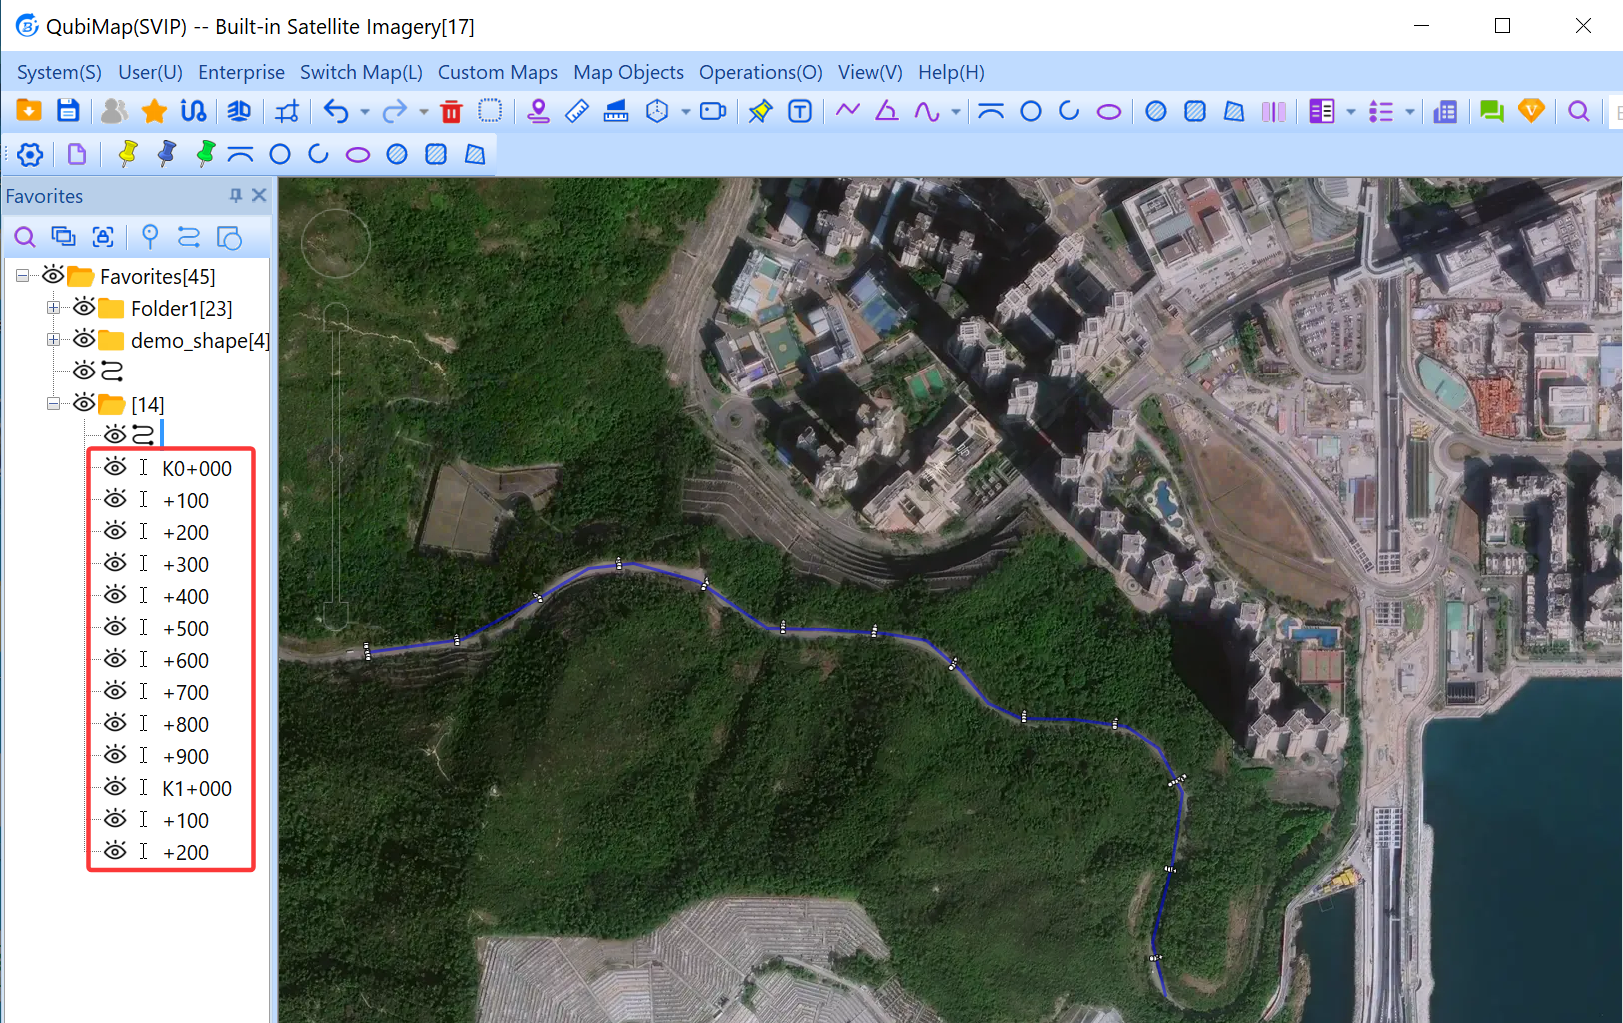
image-20260618094928566

8) Generate Filtered Track: Generate a track after filtering out track points with significant deviations.
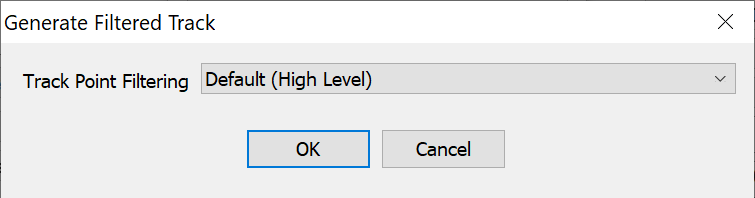
image-20260618103535245

9) Generate CAD Object by Offset: Generate a CAD object by setting the offset from the track. Set the parameters as needed, and click [OK].
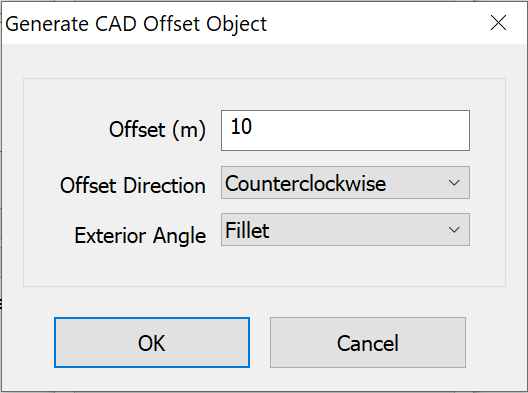
image-20260618103628946

As shown in the following figure, the yellow curve is generated by shifting the original blue track 10 meters counterclockwise:
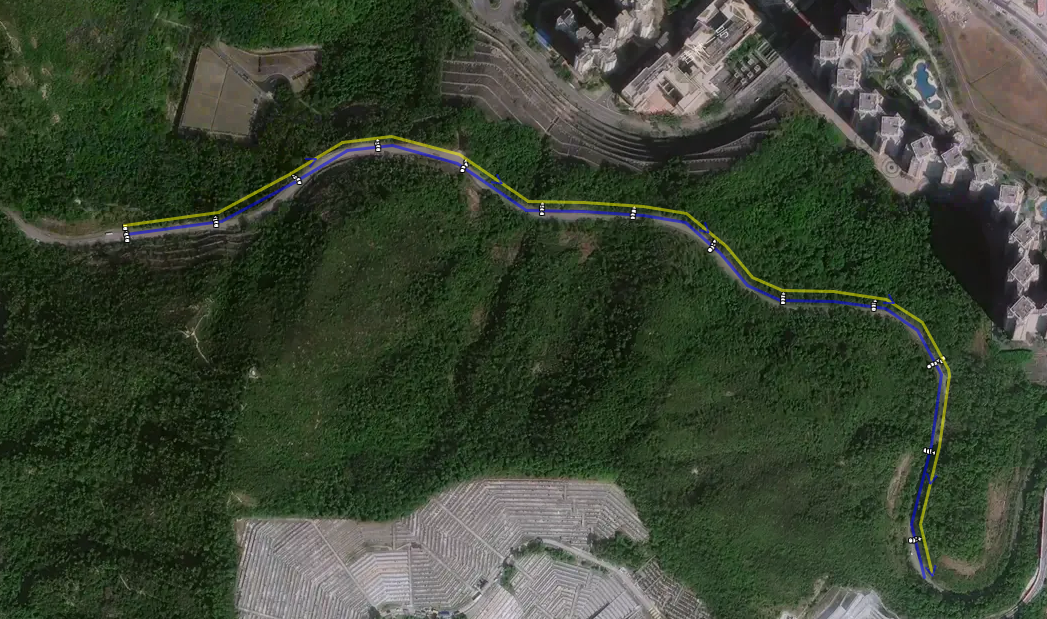
image-20260618103815771

10) Copy Track by Offset: Generate multiple tracks by setting the offset from the track. Set the parameters as needed, and click [OK].
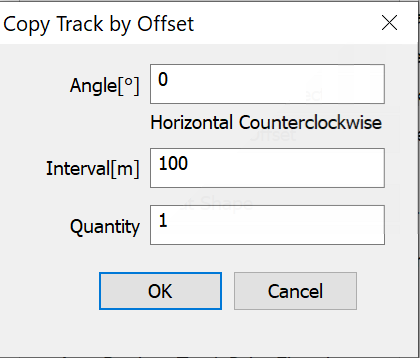
image-20260618103934242

11) Cut Shape: Use the track to split a shape.

If the track points do not intersect and the track passes through a shape, you can select the shape and click [OK]. The shape will be split into two shapes along the track.
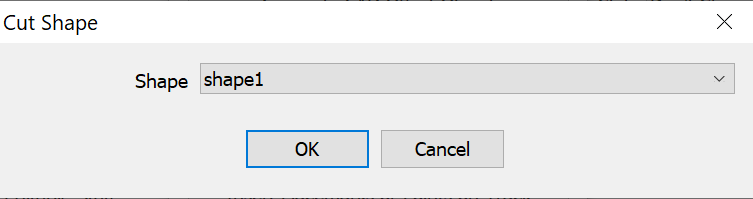
image-20260618104133930

12) Convert to Curve Based on Vertices: Convert the track to a curve based on track vertices. Enter a curve radius, and click [Generate]. The track will become a CAD polyline object.
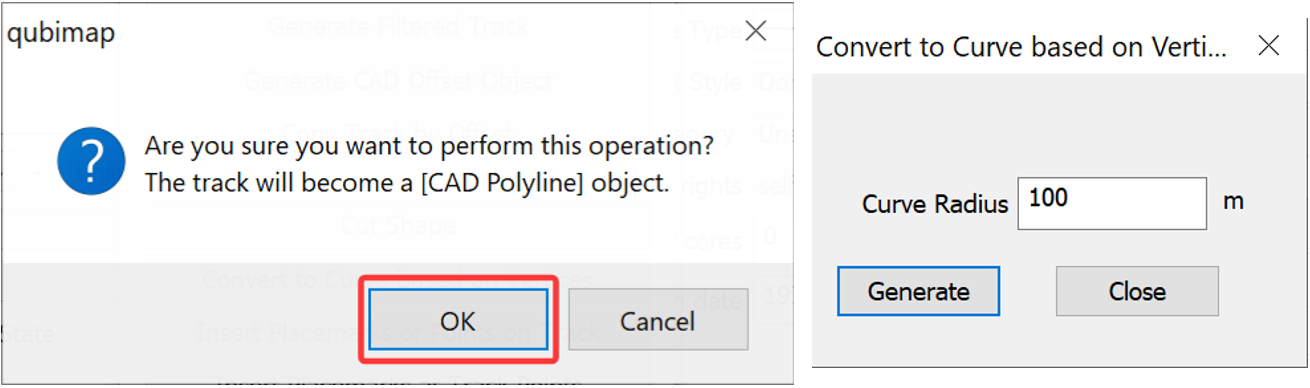
image-20260618104709412

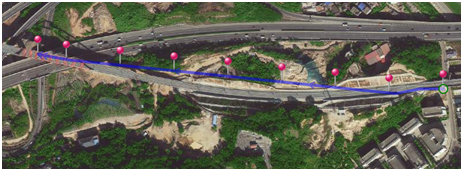
13) Insert Placemarks or Points on Track: Insert placemarks or points on the track based on your settings. Set the parameters, and click [Generate].
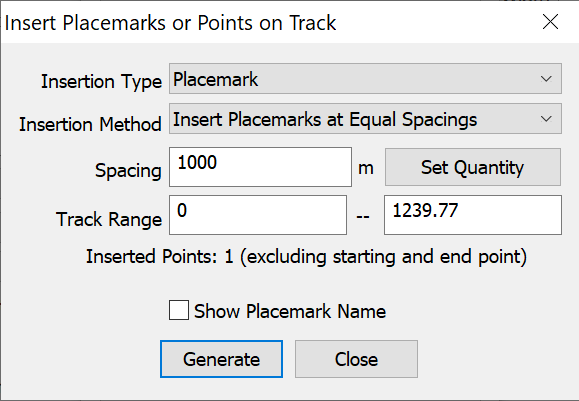
image-20260618104846728

This feature can be used for pole route design in the telecommunications and power industries. It can be combined with the Folder Object Association feature to achieve more advanced display effect.
img

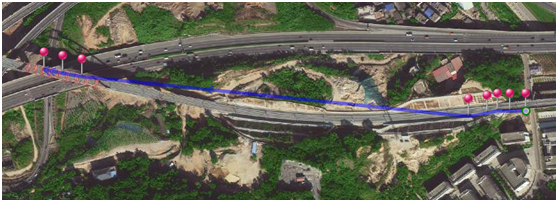
14) Insert Placemarks at Track Points: Insert placemarks on the track points. Set the parameters, and click [OK].
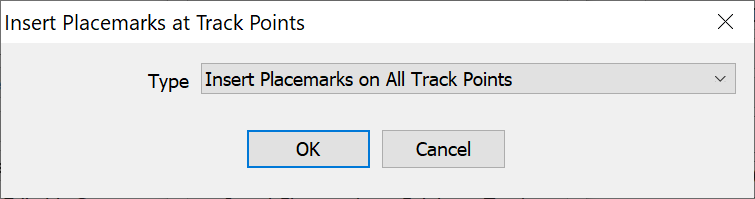
image-20260618104951786

This feature can be used for manually drawn tracks in the telecommunications and power industries.
img

15) Auto Retrieve Track Point Elevations: Generate elevation data for track points based on contour line. The following message appears after you successfully retrieve the elevation data of track points:
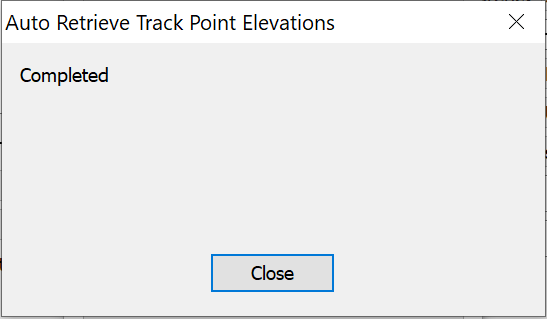
image-20260618105135092

16) Remove Track Point Time: This feature is used to export the track as a KML file, which can be further edited in Google Earth.

17) Swap Track Head and Tail: If you perform this operation on a track without the time information, the following message appears:
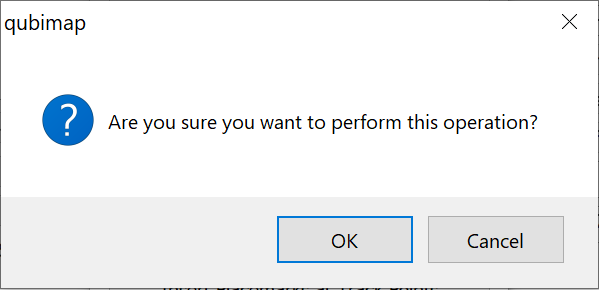
image-20260618105227441

If you perform this operation on a track with the time information, the following message appears:
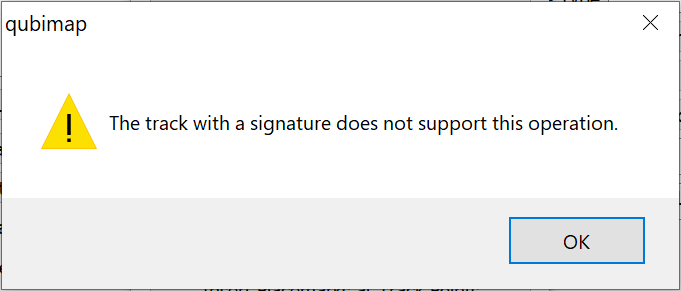
image-20260618105924135

18) Edit Track Points: Edit the latitude, longitude, and altitude n of each track points.
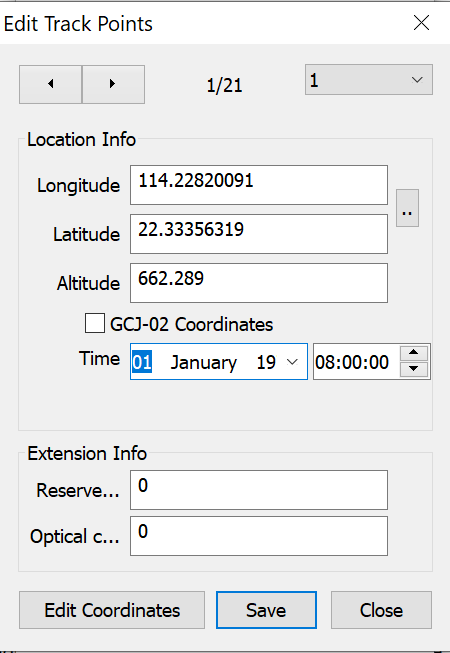
image-20260618110239585

If you enable [Track Attribute Extension Settings] in [System Settings], you can edit the extension information. If you perform the [Advanced] → [Statistics] → [Export as CSV] operation, the edited information can be shown in the generated CSV table.

19) Simplify Track: Simplify the track based on the settings. After setting the [Method] and [Intended Vertices] parameters, click [OK]. The simplified track is added to your favorites and displayed on the map.
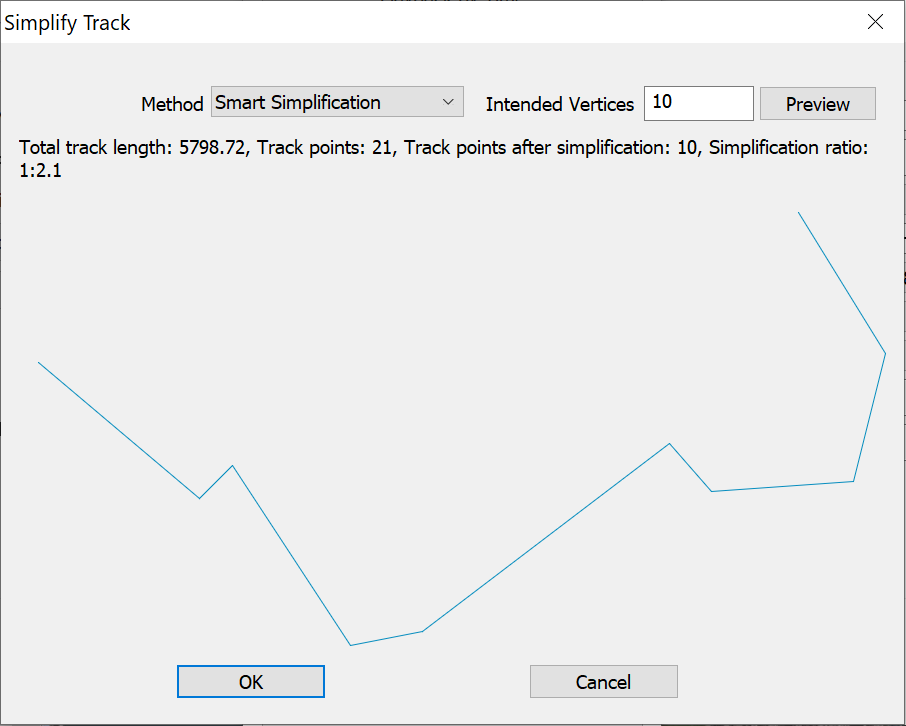
image-20260618113836554

20) Trim Track: Click on the map to draw the trimming area, and double-click to trim the track.
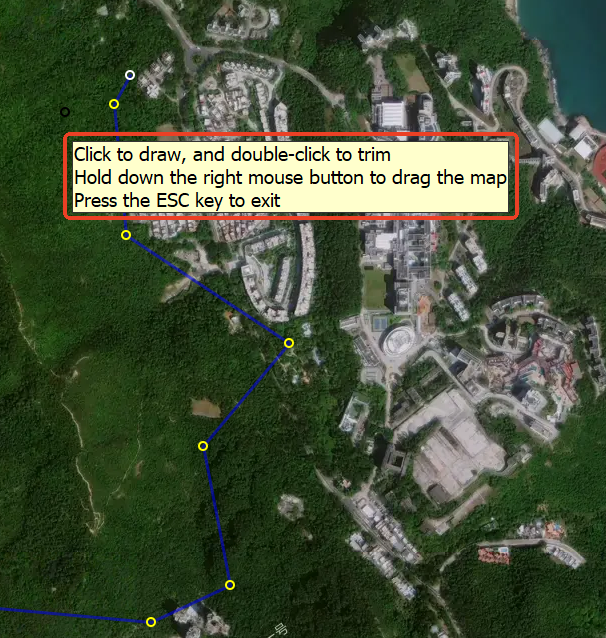
image-20260618114128114

21) Create Map Animation: Generate a track tour animation. Set the parameters as needed, and click [OK]. The generated animation is added to your favorites.

For more information about map animations, see the help documentation on the official website.
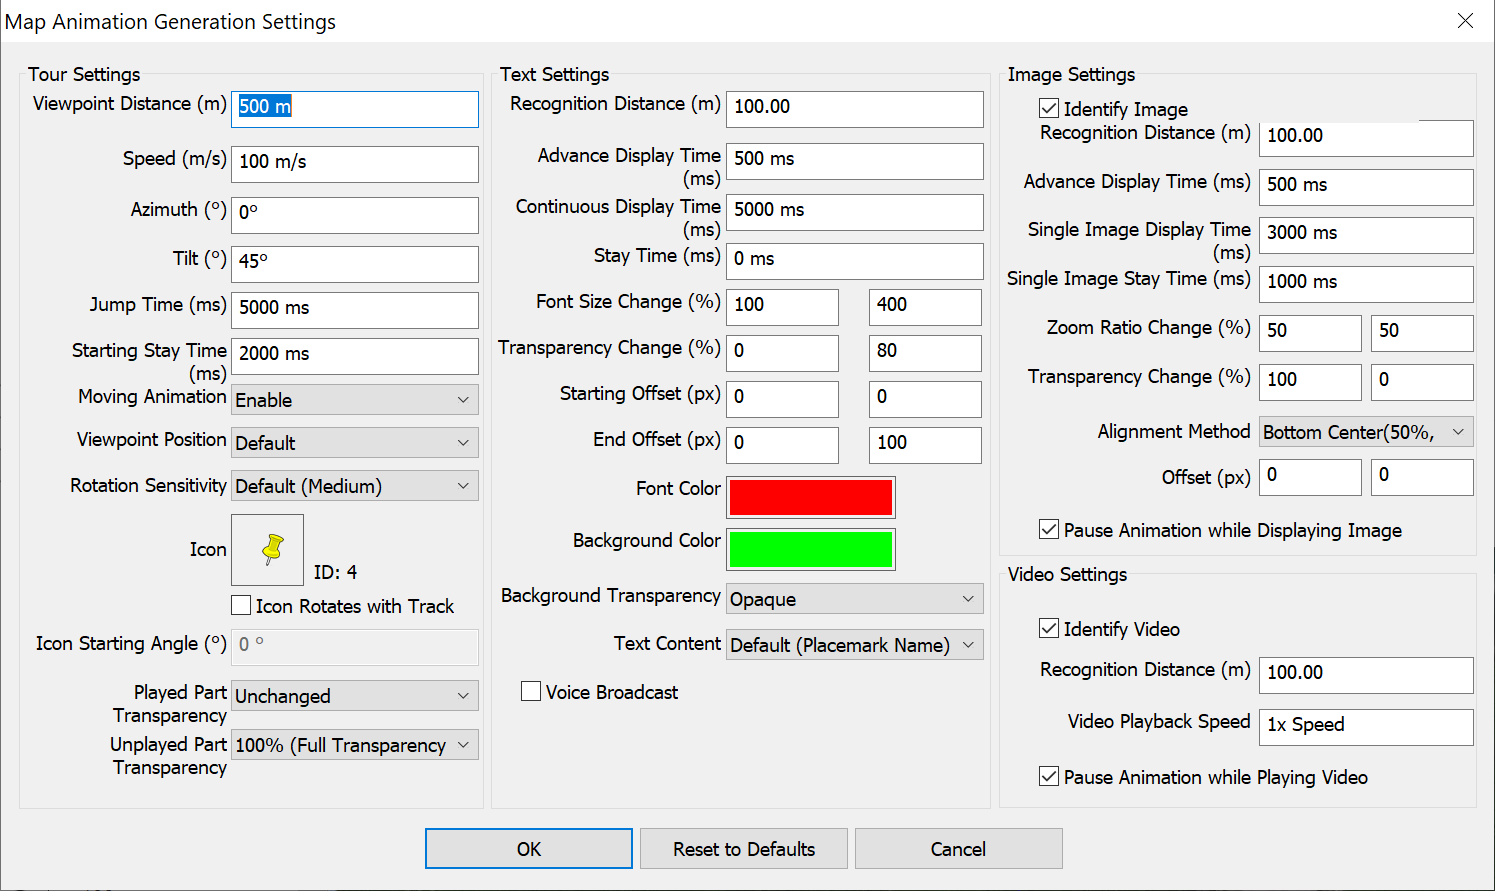
image-20260618114236897

QubiMap supports tile management mode. This article describes how to manage map tiles on PC.

Enter tile management mode

Choose [Switch Map] > [Tile Management Mode] to enter the block management mode.

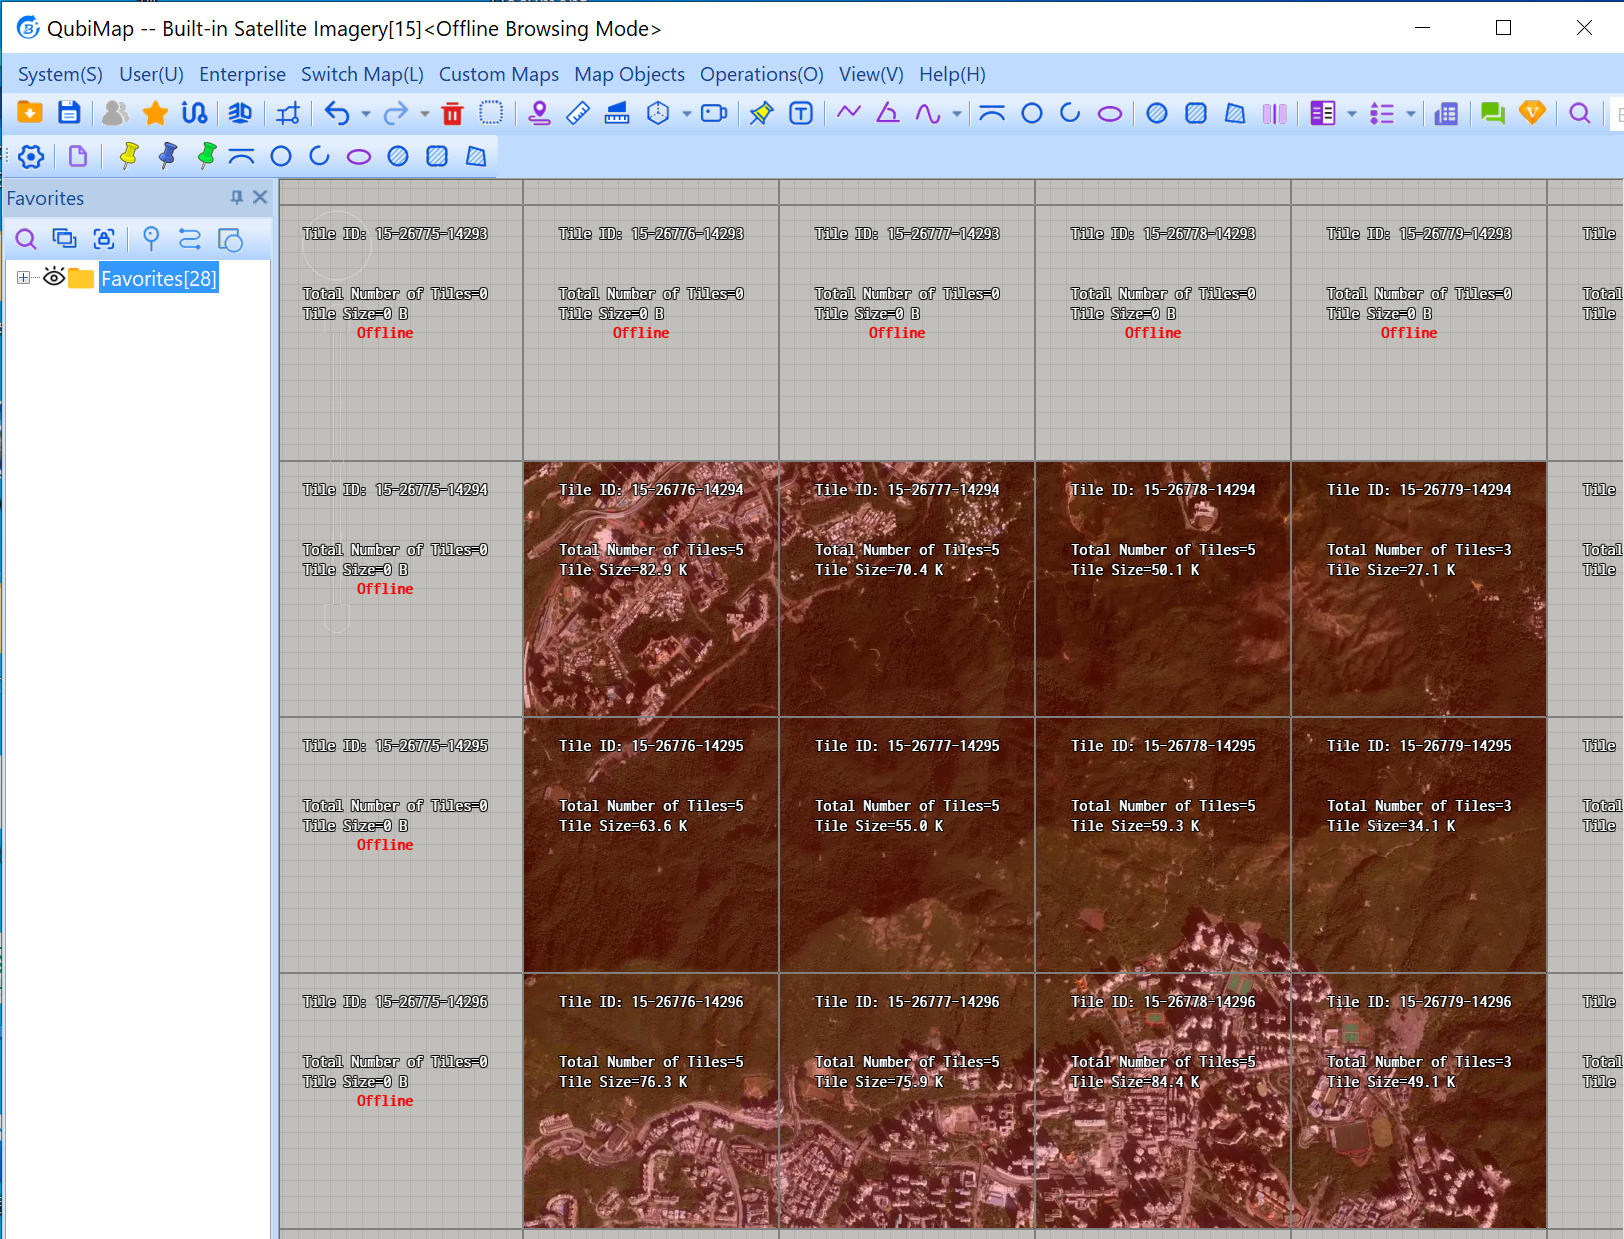
image-20260617092221719

View tile information

Each grid indicates a basic tile of the current-level map, with 256*256 px. If you zoom in by one map level, the tile area is divided into four higher-level basic tiles.

Tile ID: The format is {map level}-{horizontal tile No.}-{vertical tile No.}.

Horizontal numbering rule: Ranging from left to right, beginning with 0000.

Vertical numbering rule: Ranging from top to bottom, beginning with 0000.

Total Number of Tiles: The total number of higher-level tiles within the current tile area. If you use the satellite imagery overlaid with road networks, this value indicates the total number of tiles for both types of map layers.

Tile Size: The total size of higher-level tiles within the current tile area.

In a tile, some areas may be highlighted in red, which indicates that more higher-level map data has been downloaded for these areas.

Manage a tile

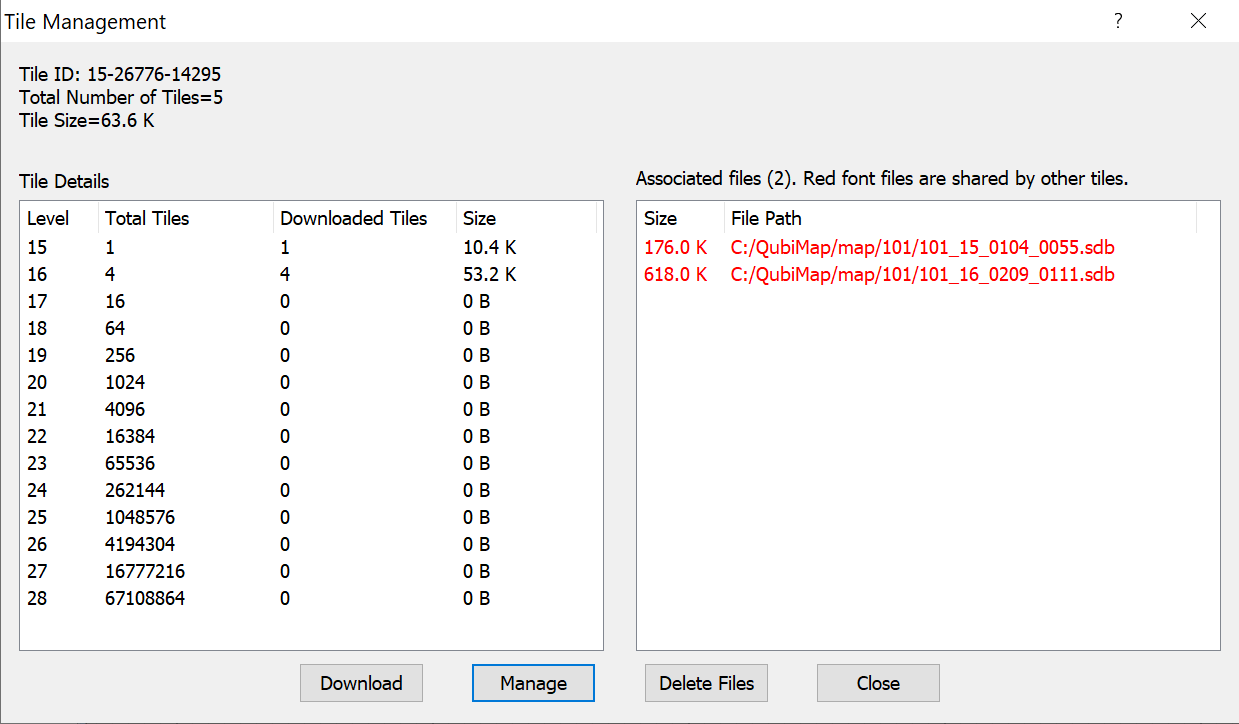
Click on a tile to go to the [Tile Management] dialog box, as shown in the following figure:

image-20260617093839444

In the [Tile Details] section, you can view the total number of tiles, the number of downloaded tiles, and the size of downloaded tiles at each map level.

The map files associated with this tile are shown in the right section. Files in black are called inclusively by the current tile while files in red are shared by other tiles. If you delete files in red, other tiles cannot be normally displayed. You can delete multiple files at a time. To locate a file, double-click it; then, you can copy it to other devices.

Operations:

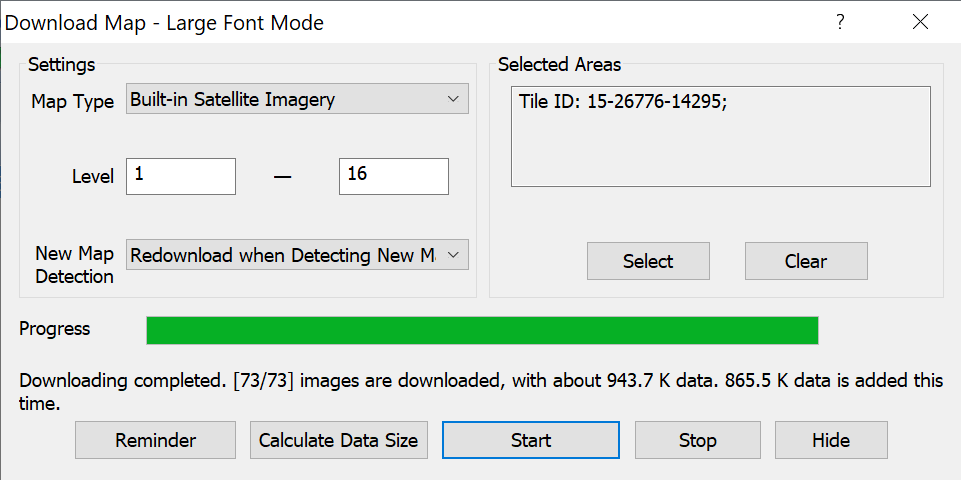
Click [Download] to download the map data of the current tile area, as shown in the following figure:

image-20260617093936117

After the [Download Map] dialog box appears, a temporary shape is generated at the current tile location. You can right-click on the tile and select [Tile ID] to go to the [Shape Settings] dialog box, and then you can add the shape to your favorites.

Click [Manage] to manage the map data of the current tile area, as shown in the following figure:

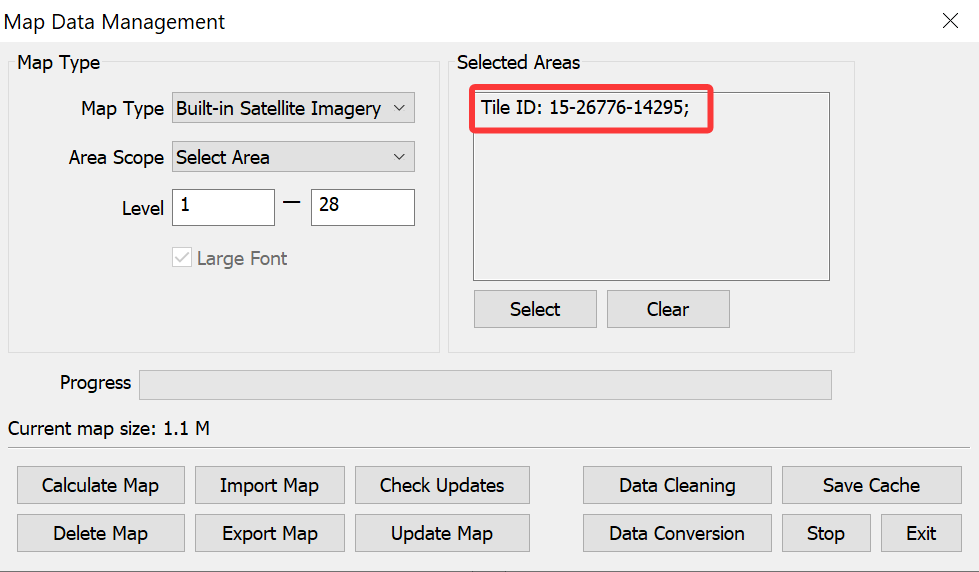
image-20260617094126000

After the [Map Data Management] dialog box appears, a temporary shape is generated at the current tile location. You can right-click on the tile and select [Tile ID] to go to the [Shape Settings] dialog box, and then you can add the shape to your favorites.

Click [Delete File] to delete the selected associated files (map data) in the current tile area.

In QubiMap, you can download map data of specific areas for offline browsing and data sharing. To share the downloaded map data, you can enable the HTTP tile service for other devices. You can also use the Qubimap enterprise map service to share the data within your enterprise .

Any PC or mobile client of QubiMap that is connected to the Internet can be used to download map data.

This article describes how to download map data on a computer. For information about how to map data on a mobile device, see the help document “How to download map data on a mobile device”.

1. Download map data on your PC

You can select a system area or draw a custom area to download map data.

1.1. Procedure

1.1.1. Download map data of a system area

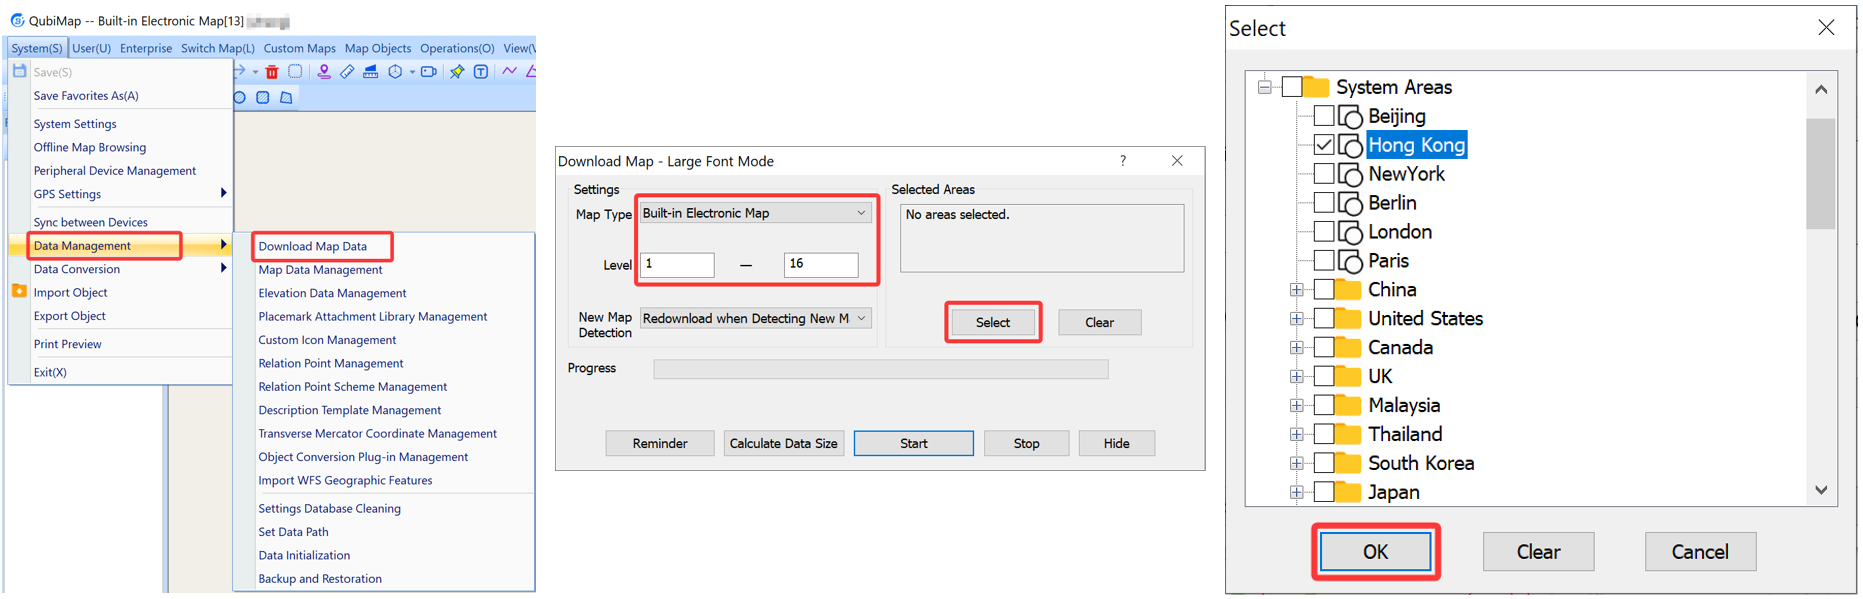
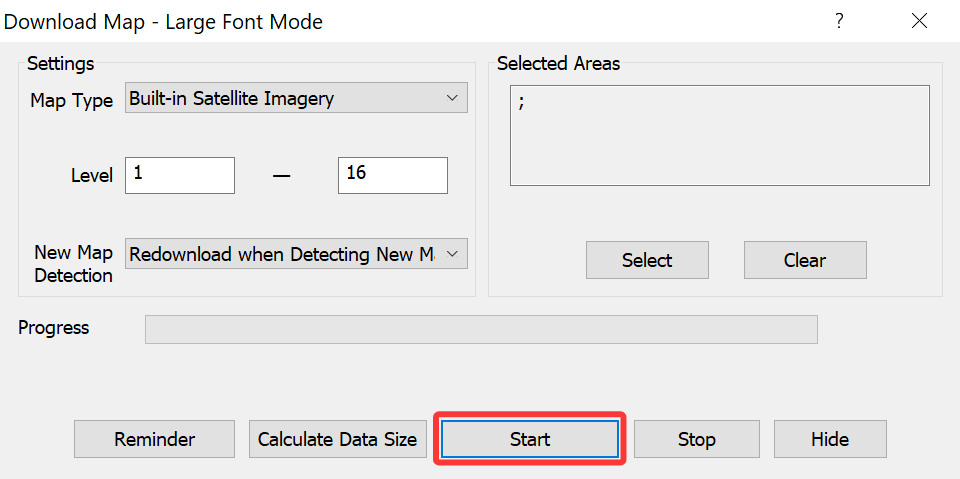
Choose [System] > [Data Management] > [Download Map Data]. In the [Download Map] dialog box, set the parameters as needed.

  • Map Type: Select a built-in map or a custom map.

  • Level: The higher the level, the clearer the map. Each level increase quadruples the map data size. The maximum level is 18. If you select a level higher than 18, the map does not become clearer, but the pixel size increases.

  • Selected Areas: Click [Select] to select areas. In the dialog box that appears, expand [System Areas], select the required areas, and click [OK]. We recommend that you select only a city each time to avoid the overwhelmingly large data volume.

image-20260615094201058

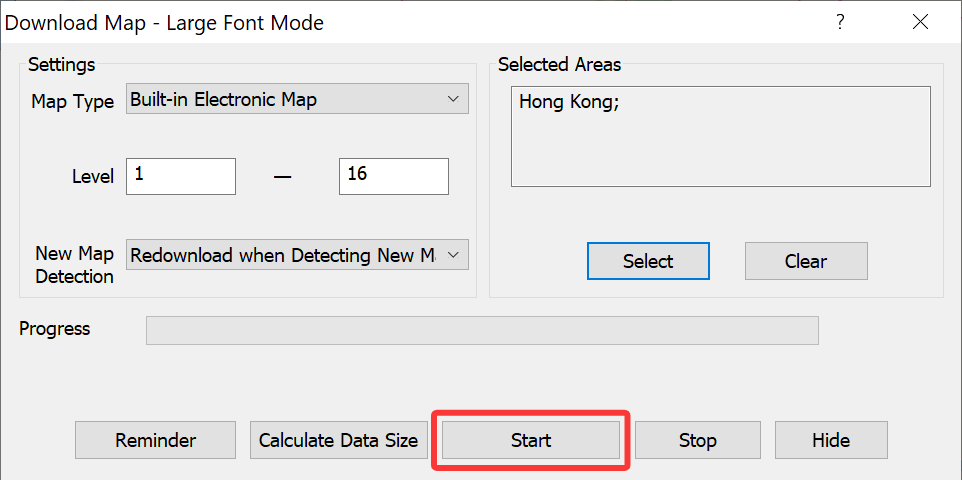
Click [Start] to start downloading.

image-20260615094318047

1.1.2. Download map data of a custom area

You can draw a rectangle, polygon, or circle on the map to specify an area. In this example, a polygonal area is drawn.

Click the polygon button in the toolbar, and draw an area as instructed.

image-20260615100602675

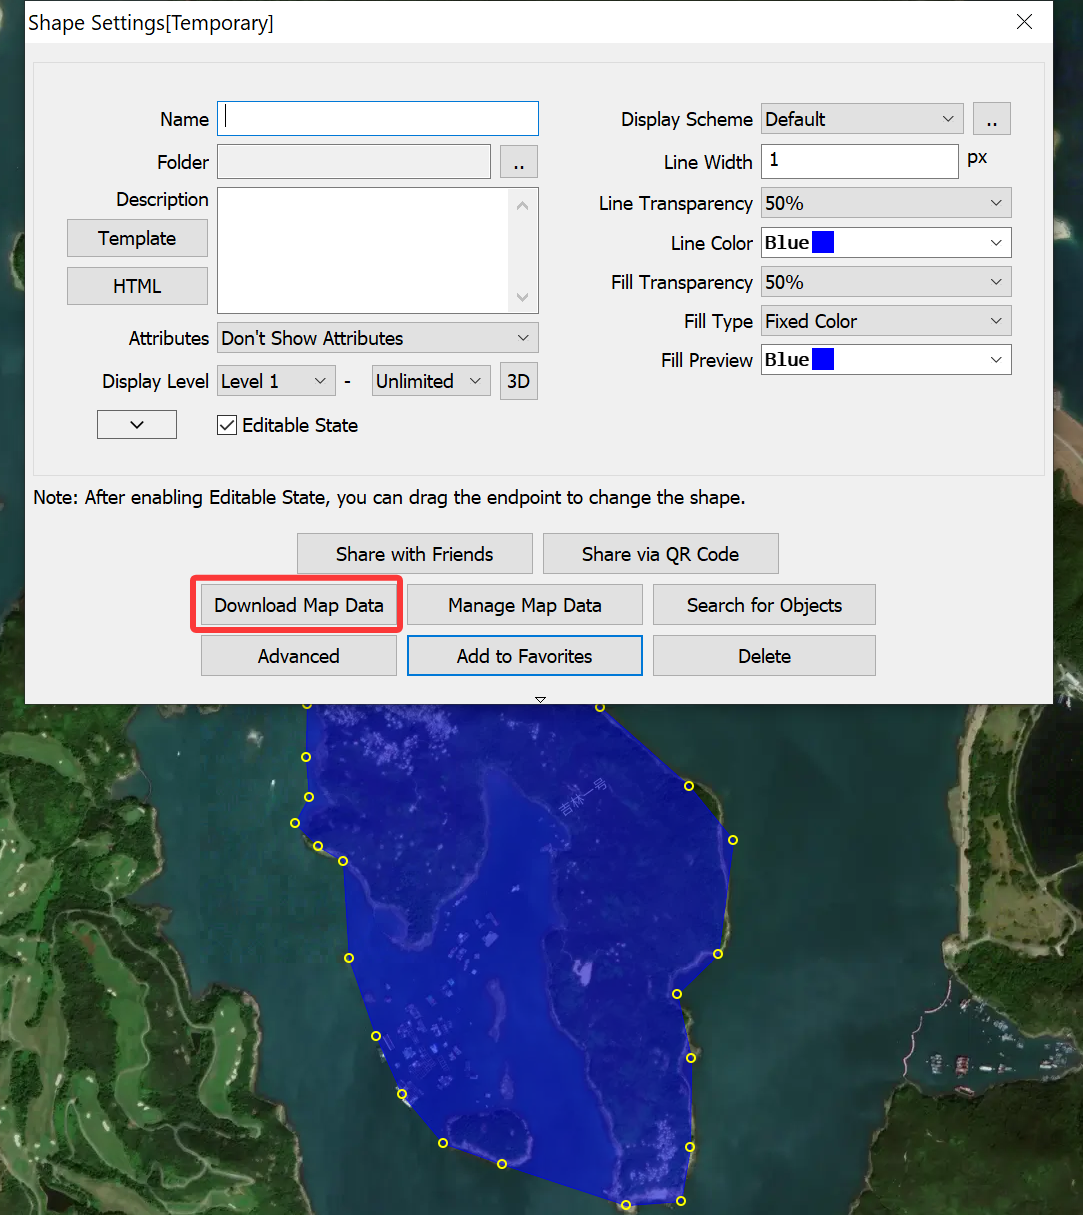
When drawing the last vertex, double-click the left mouse button. In the [Shape Settings] dialog box, click [Download Map Data].

image-20260615095828842

In the [Download Map] dialog box, set the parameters as needed, and click [Start].

image-20260615100845946

1.2. Offline map storage directories

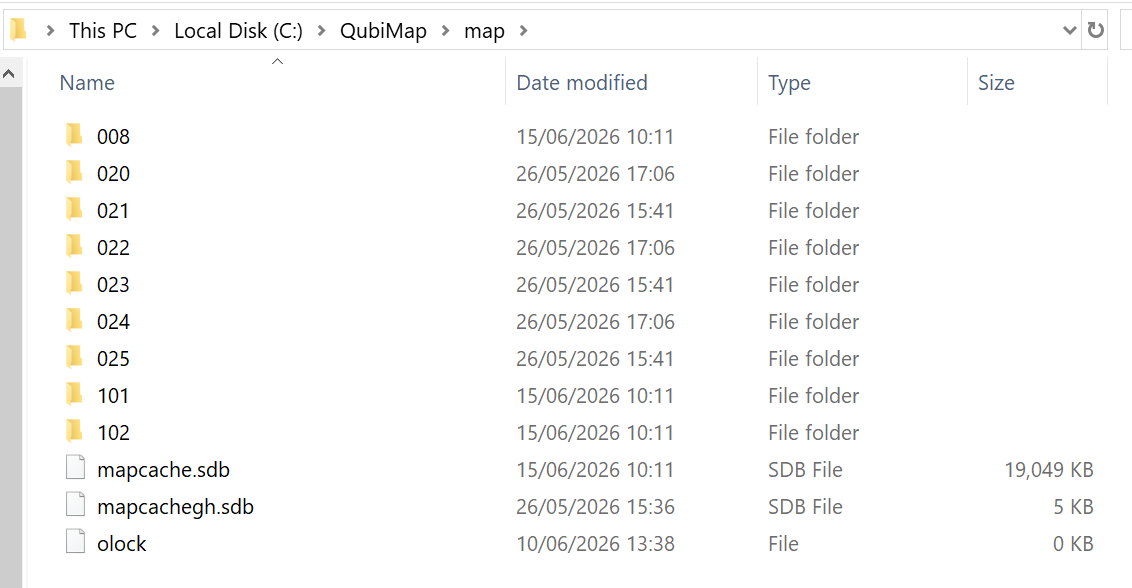
Downloaded map tile data is saved in the map folder under the QubiMap root directory. The path may vary based on user settings. In this example, a Windows PC is used. The path of the root directory is C:\QubiMap.

The subfolders in the map folder are named with numbers, which indicate different maps. 101: built-in satellite imagery; 102: built-in electronic map. Numbers above 200 indicate custom maps.

image-20260615101321780

2. Applications

After downloading map data to your local storage, you can perform the following operations:

(1) Browse the map data in the offline environment on your PC

Choose [System] > [Offline Map Browsing].

Only the areas with the map data downloaded are displayed on the map.

(2) Send the map data to other devices

For more information, see the help document “How to send offline map data from a PC to mobile device“.

(3) Enable the HTTP tile service for other devices to access the map data

For more information, see the help document “How to enable the WEB tile service in QubiMap“.

(4) Export the map data as an image

For more information, see the help document “How to export QubiMap data as an image“.

Maps are essential whether for outdoor adventures such as hiking and mountain climbing or professional work like surveying. QubiMap allows you to export maps and other objects such as placemarks, tracks, and shapes as images (JPG, TIFF, PNG, BMP, etc.).

This article describes how to export maps and QubiMap objects as JPG or PNG images.

☆ Notes:

  • This feature is only available to VIP or SVIP users.

  • The size of pixels increases with the map area and map level.

  • The maximum size of an image that can be exported is 4.2 billion pixels (700 million pixels for a PNG or BMP image), covering an area of approximately 900 km² (rectangular area). The length of each side can be up to 65,536 pixels, about 30 km.

The procedure is as follows:

1. Download map data

To export maps and QubiMap objects as images from QubiMap, you first need to download map data for the required area. You can draw an area or select a system area.

For more details, see the help document “How to download map data (PC)“. We recommend that you draw a custom area to download the map.

2. Export as an image

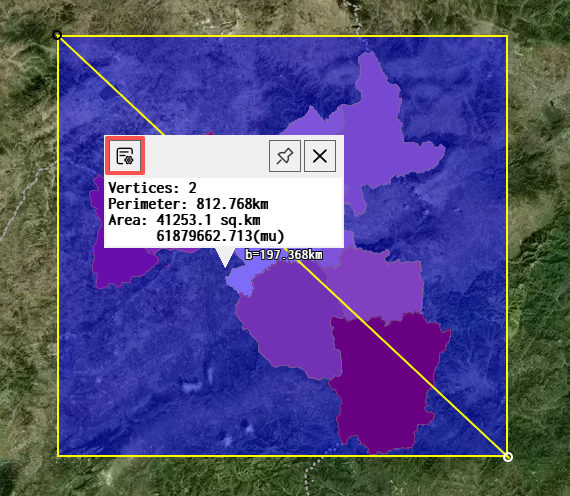
After you download the map, click on the area on the map and then click the C978CEE0-1ABB-45dc-A8A8-7D879B9897E3 button.

image-20260514164816416

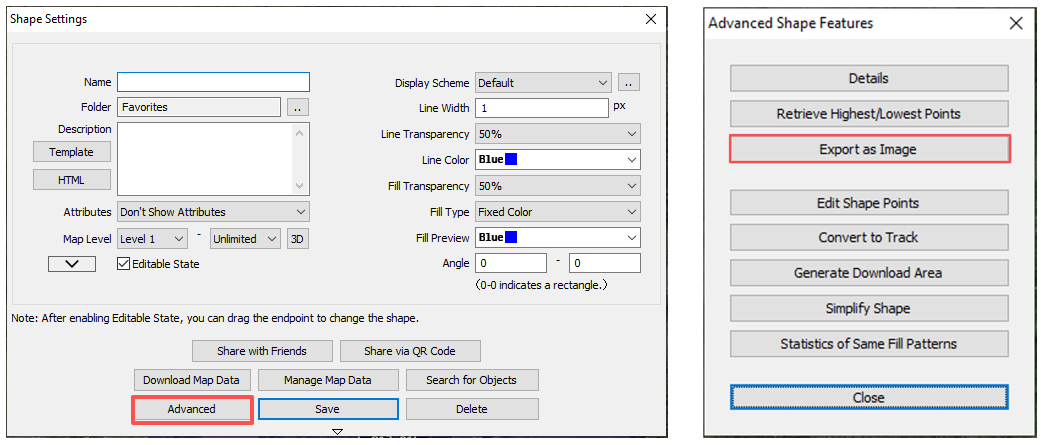
In the [Shape Settings] dialog box, click [Advanced] → [Export as Image].

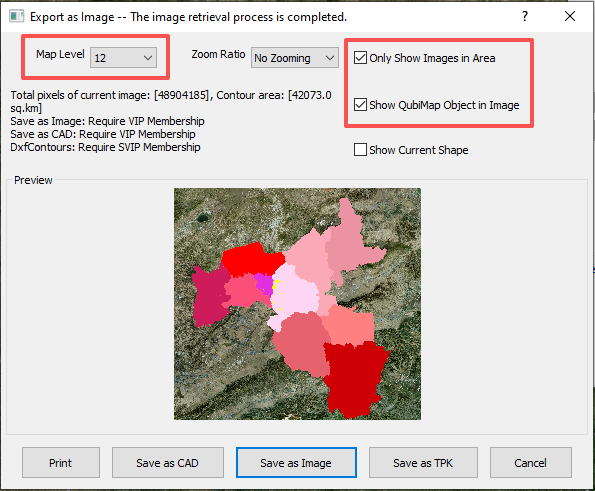
Set the map level, and select [Only Show Image in Area].

  • Map Level: Set this value based on the shape area and print size. Generally, map levels 12 to 16 are appropriate; if you set it to level 17 or 18, the image size may be too large.

  • Only Show Image in Area: We recommend that you select this option; otherwise, map data outside the specified area will be exported.

  • Show QubiMap Object in Image: Select this option if you need to export objects such as placemarks, tracks, or shapes within the area.

image-20260514165239983

★ Note:

  • The [Save as Image] feature is only available to VIP or SVIP users.

  • If the exported map area expands or the map level raises, the image size increases.

  • The length of any side of a rectangular area cannot exceed 65536 pixels (about 30 km); otherwise, it cannot be exported. For a polygonal area, the outer rectangle is used for reference.

  • If the image cannot be previewed, we recommend that you lower the map level or reduce the size of the exported area.

The following table shows the limits corresponding to VIP levels and image formats:


VIP level Image format Pixel limit QubiMap object limit
VIP JPG, TIF, PNG, BMP 100,000,000 20,000
SVIP PNG, BMP 700,000,000 1,000,000
JPG, TIF 4,200,000,000 1,000,000

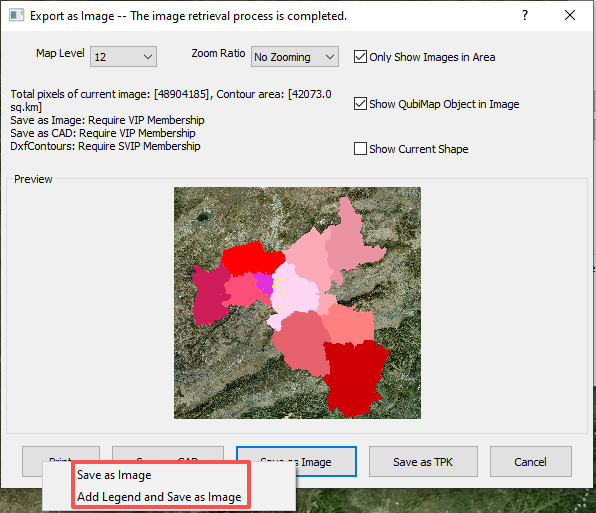
After you set the parameters, click [Save as Image] → [Save as Image] or [Add Legend and Save as Image].

  • If you are sure you have downloaded all map data but still receive a message indicating that some images have not been downloaded, click [No].

  • If the exported image has more than 700 million pixels, the following message appears: Images of more than 700 million pixels can only be exported in JPG and TIF formats. Click [OK].

  • If the image has no more than 700 million pixels, the [Save As] dialog box appears.

image-20260514165327259

In this example, click [Save as Image] → [Add Legend and Save as Image].

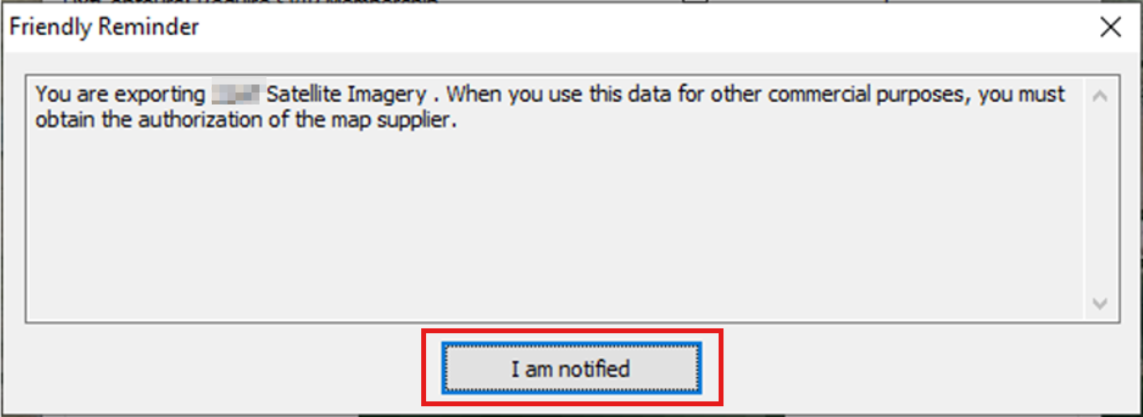
The following friendly reminder appears. Click [I am notified].

image-20260515135244512

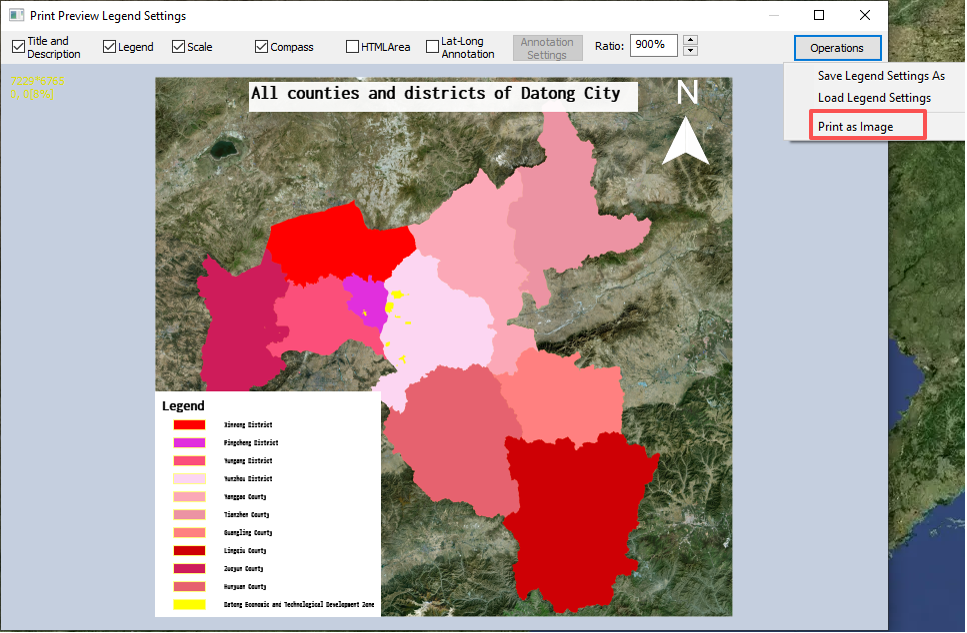
In the [Print Preview Legend Settings] dialog box, set the parameters as needed. Then, click [Operations] → [Print as Image].

image-20260514170907005

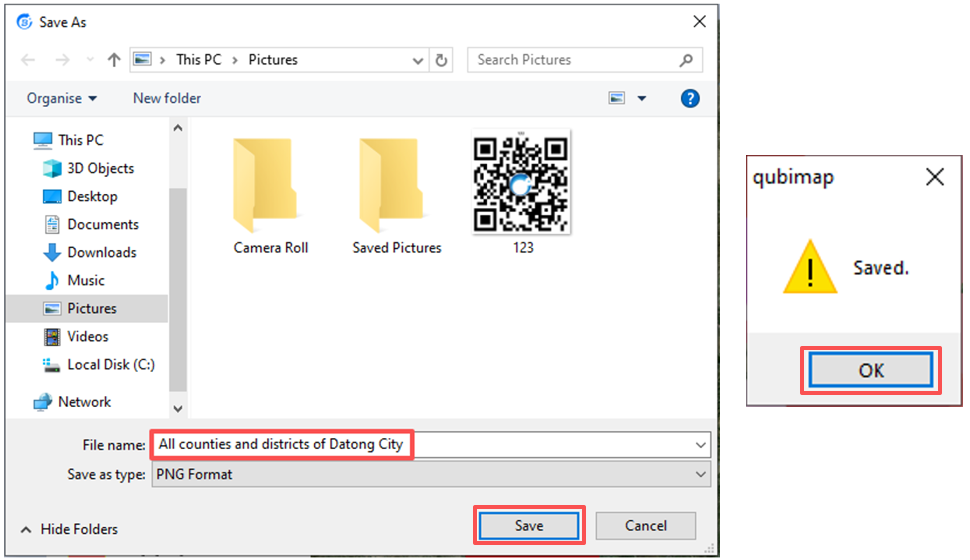
Enter a file name, set the file format as JPG, PNG, or BMP, and then click [Save].

In the message that appears, click [OK].

image-20260514171636514

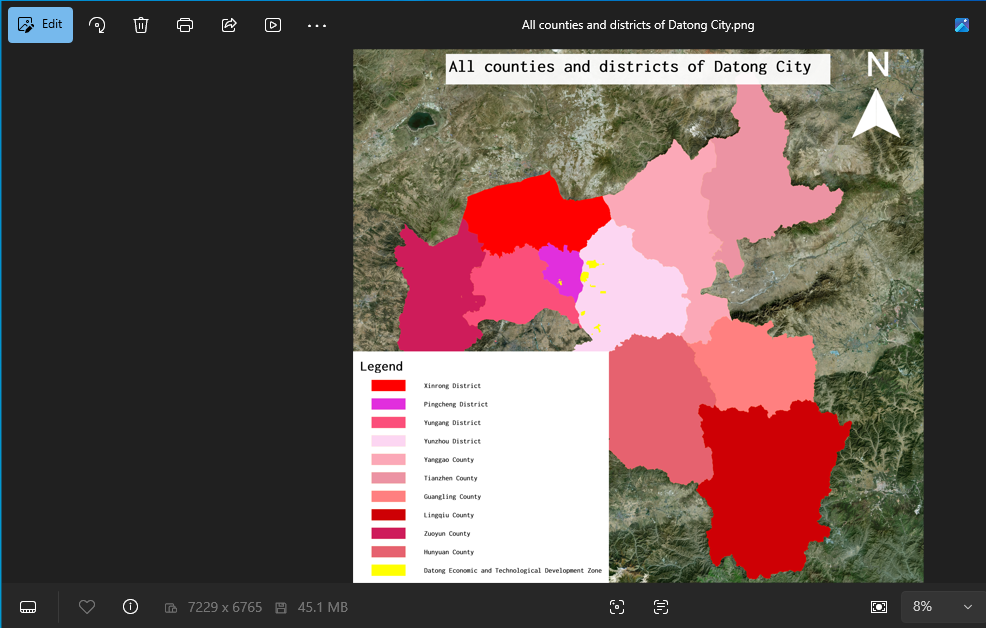
The exported image is shown as follows. In this example, the map level is set to 12. The display is optimal when you set the zoom ratio to 100%.

image-20260514172510713

After exporting the image, you can print it.

In QubiMap, you can import elevation data to view contour lines. Currently, QubiMap supports elevation data in various formats such as TIFF, ASC, ZIP, OVTMP, and SDB, which can be overlaid on the built-in SRTM or ASTER elevation data.

1. Import elevation data to QubiMap on PC

1) Set the elevation data type

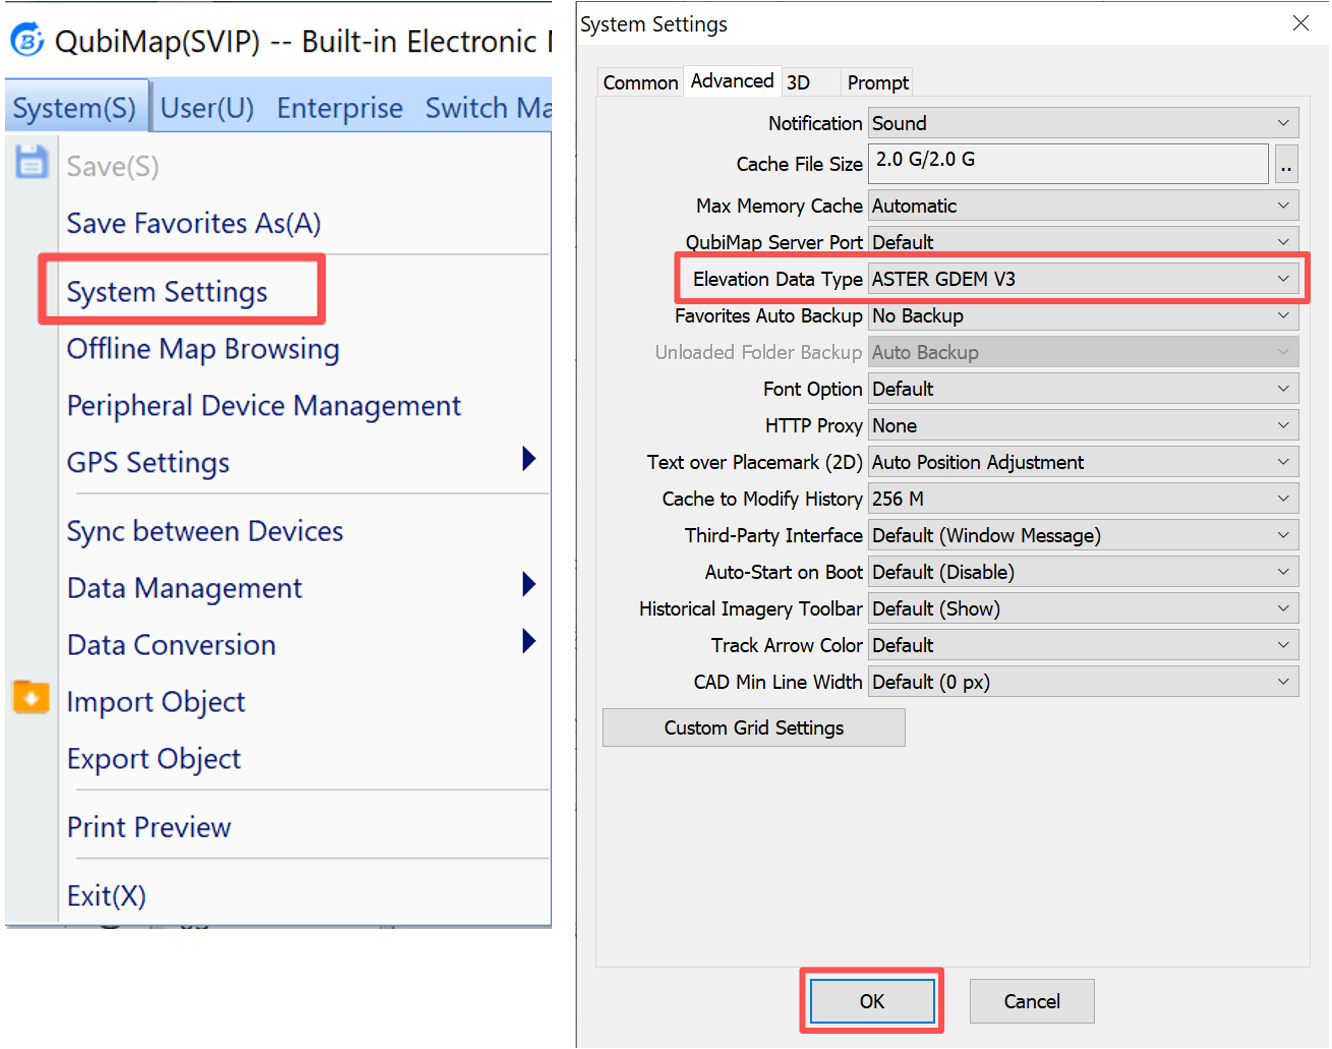
Choose [System] > [System Settings] > [Advanced] > [Elevation Data Type] to set the elevation data type. You can select [ASTER GDEM V3] or [STRM3]. In this example, [ASTER GDEM V3] is selected. Then, click [OK].

image-20260513153513658

2) Import elevation data

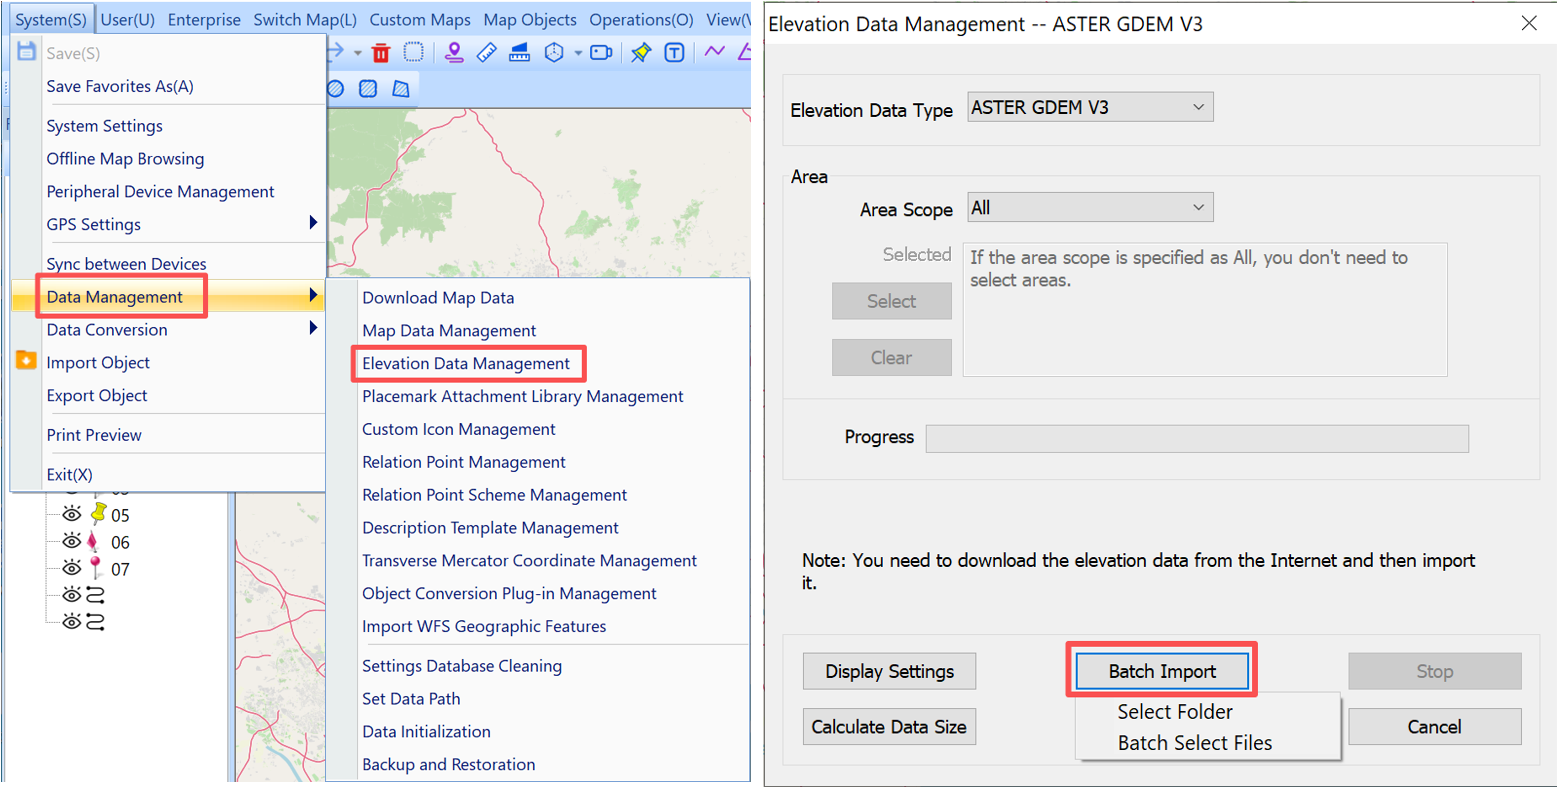
Choose [System] > [Data Management] > [Elevation Data Management]. In the dialog box that appears, click [Batch Import].

image-20260513162352799

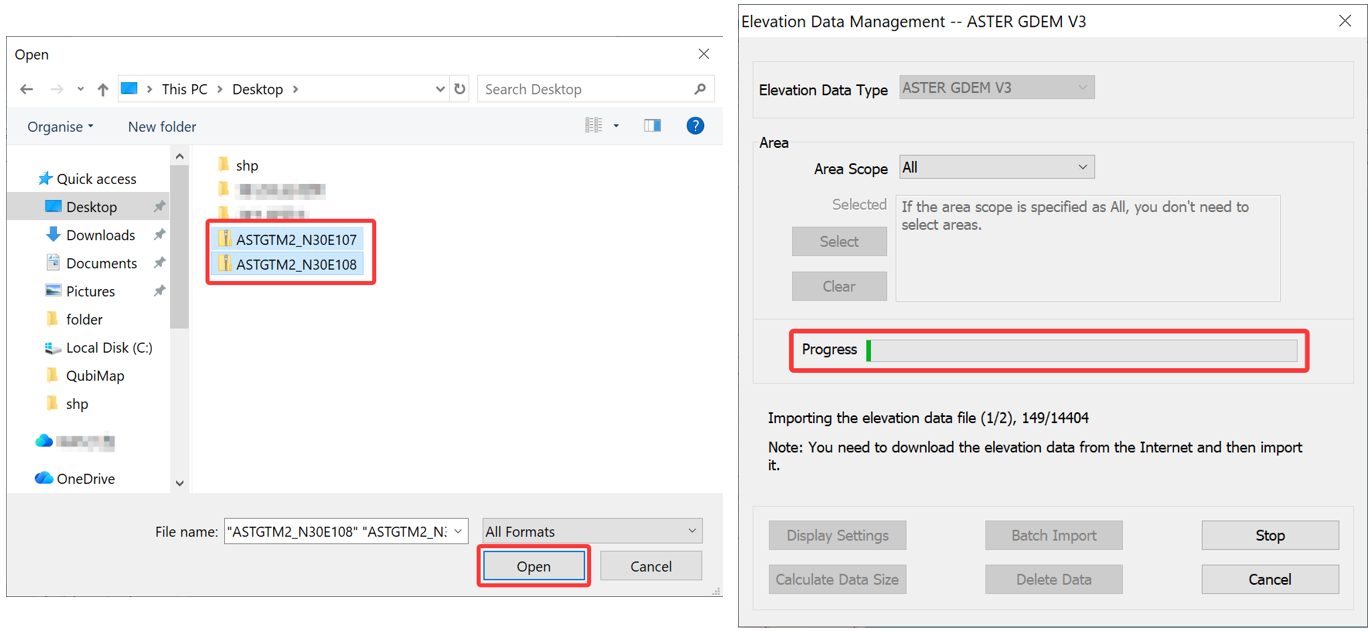
Select the elevation data file to be imported. You can select multiple files at a time. Then, click [Open]. The selected files are imported into QubiMap.

image-20260526151208237

3) View contour lines

After importing the elevation data, you can view the contour lines in QubiMap.

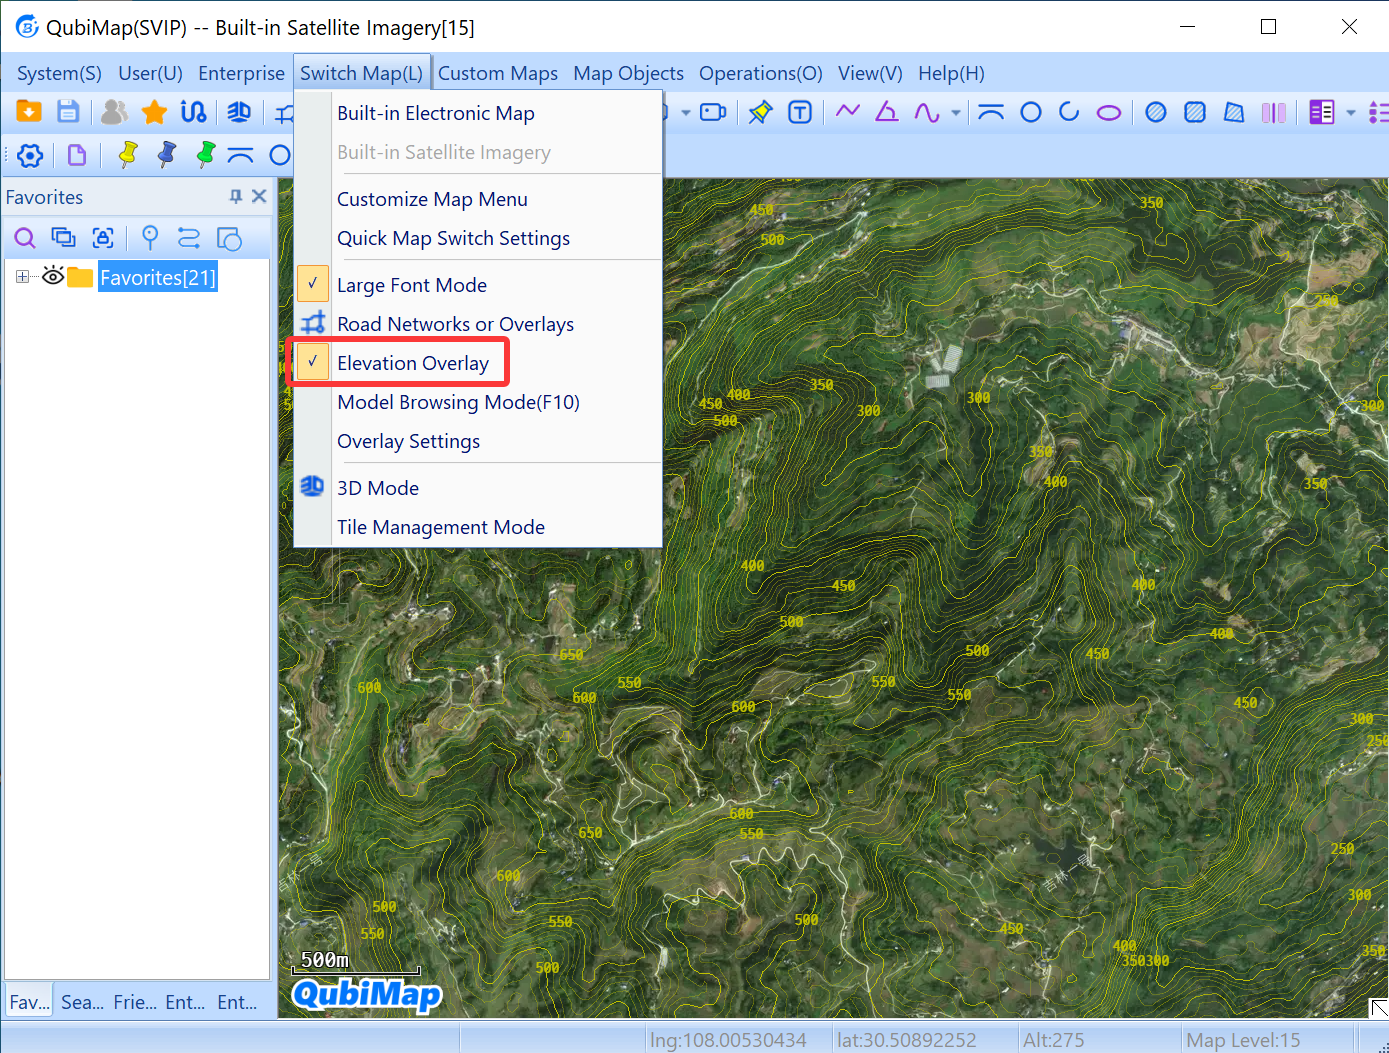
Choose [Switch Map] > [Elevation Overlay].

Set the map zoom level to 12 or higher to show the contour lines.

image-20260526151811291

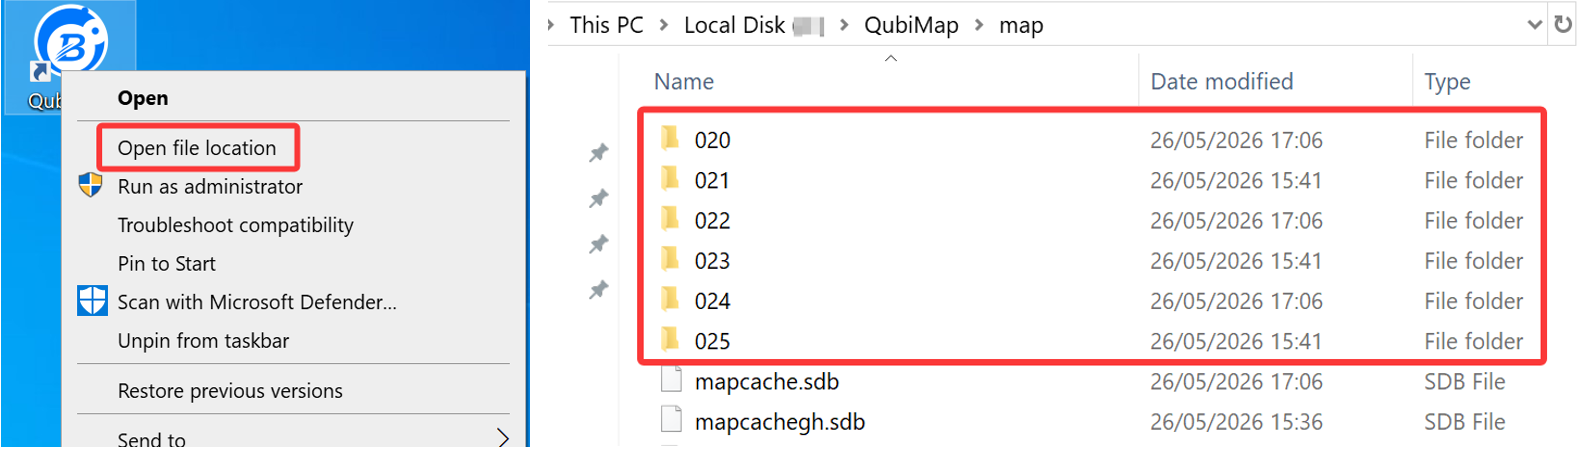
☆ Note: The imported elevation data is stored in the map folder under the QubiMap root directory.

image-20260526171853409

The following table shows the storage folders for different types of elevation data.

Elevation data type Projection type Storage folder
SRTM3 Mercator(china) map\024
Mercator map\020
LatLng map\022
ASTER GDEM V3 Mercator(china) map\025
Mercator map\021
LatLng map\023

2. Import elevation data to QubiMap on a mobile device

1) Set the elevation data type

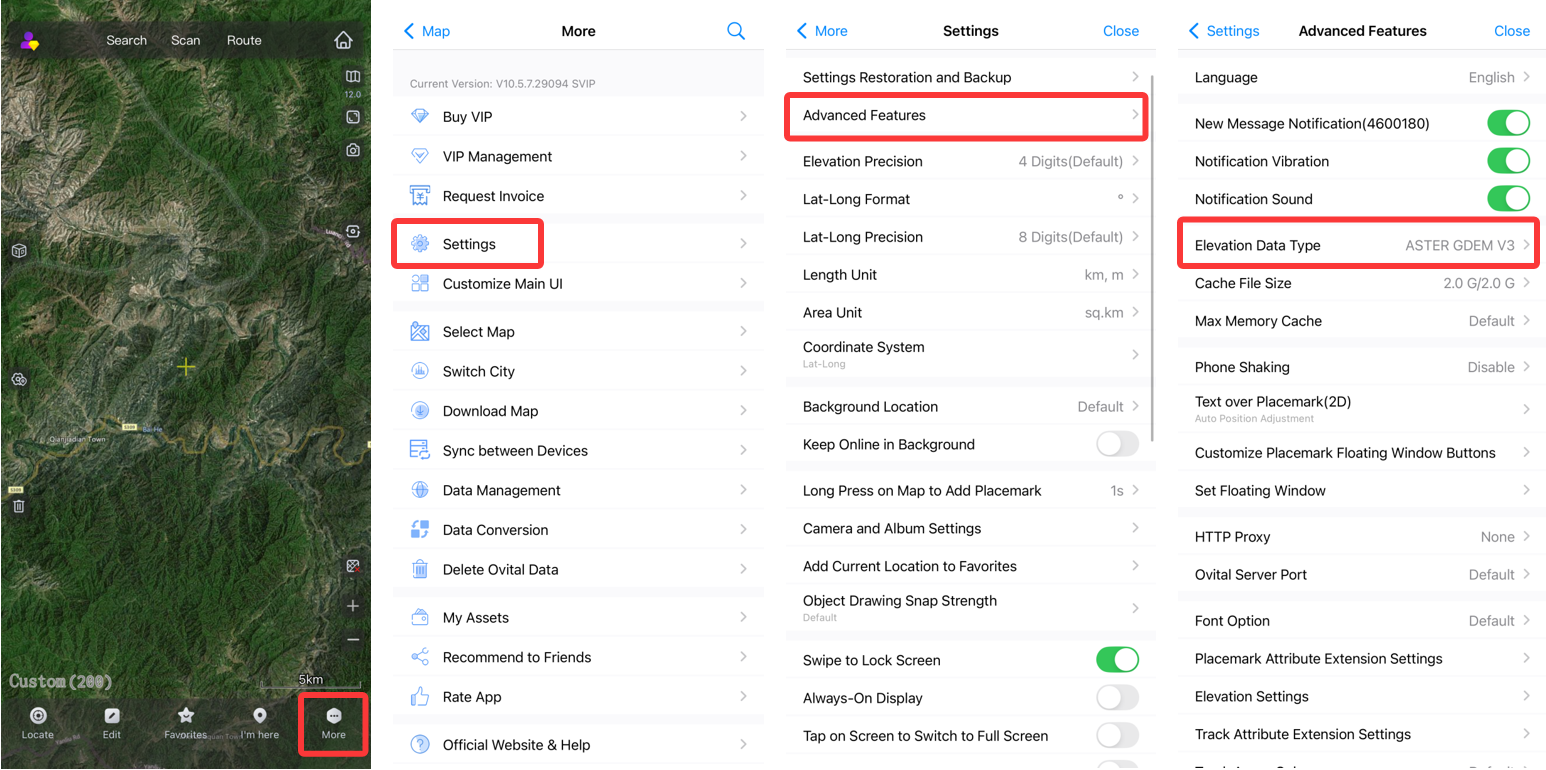
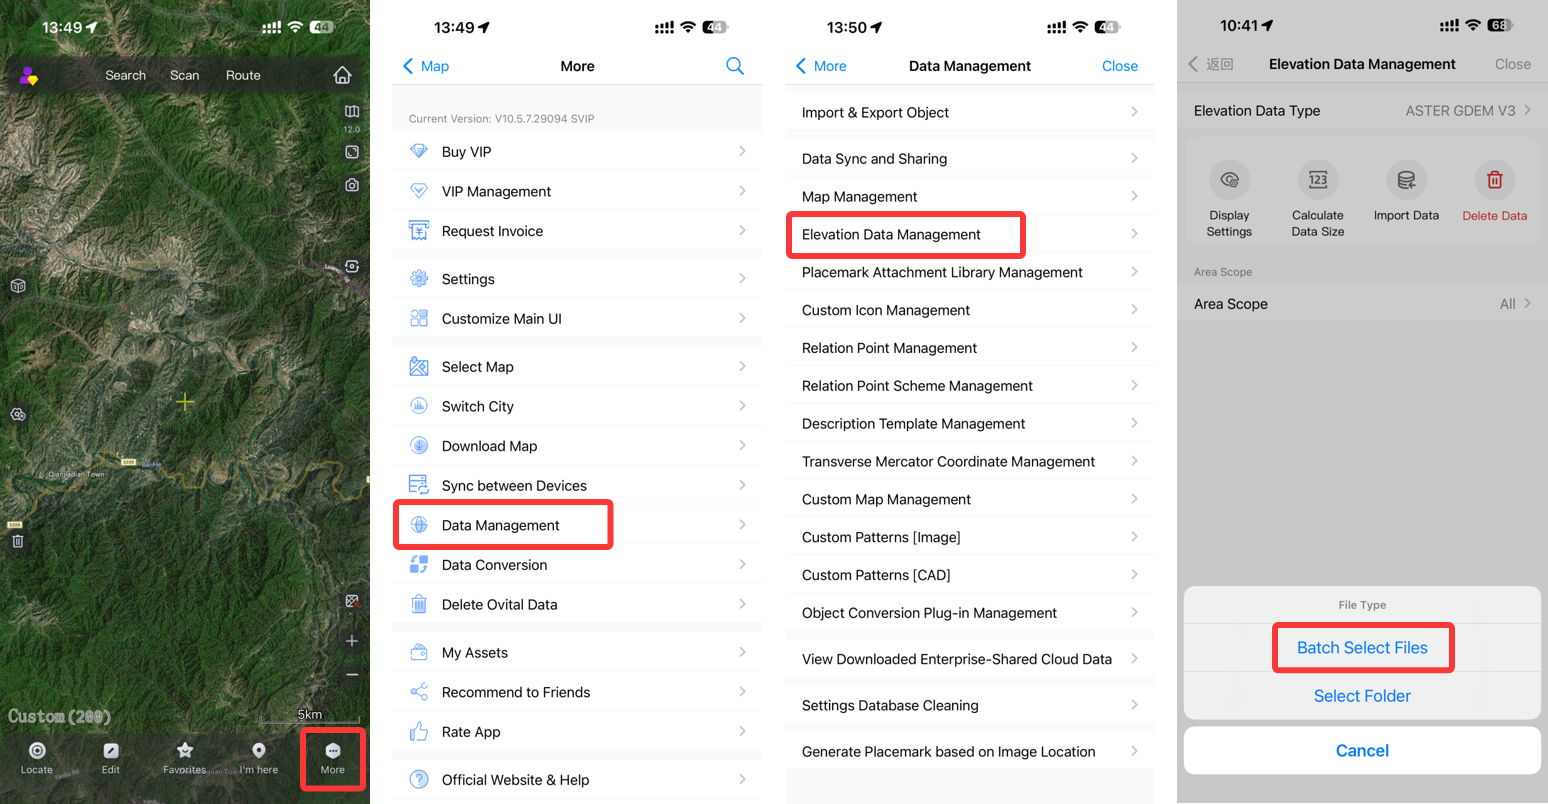
On the main UI of the QubiMap mobile app, choose [More] → [Settings] → [Advanced Features] → [Elevation Data Type].

You can select [ASTER GDEM V3] or [STRM3]. In this example, [ASTER GDEM V3] is selected.

image-20260609093203155

2) Import elevation data

Choose [More] → [Data Management] → [Elevation Data Management] → [Import Data] → [Batch Select Files].

image-20260609105810747

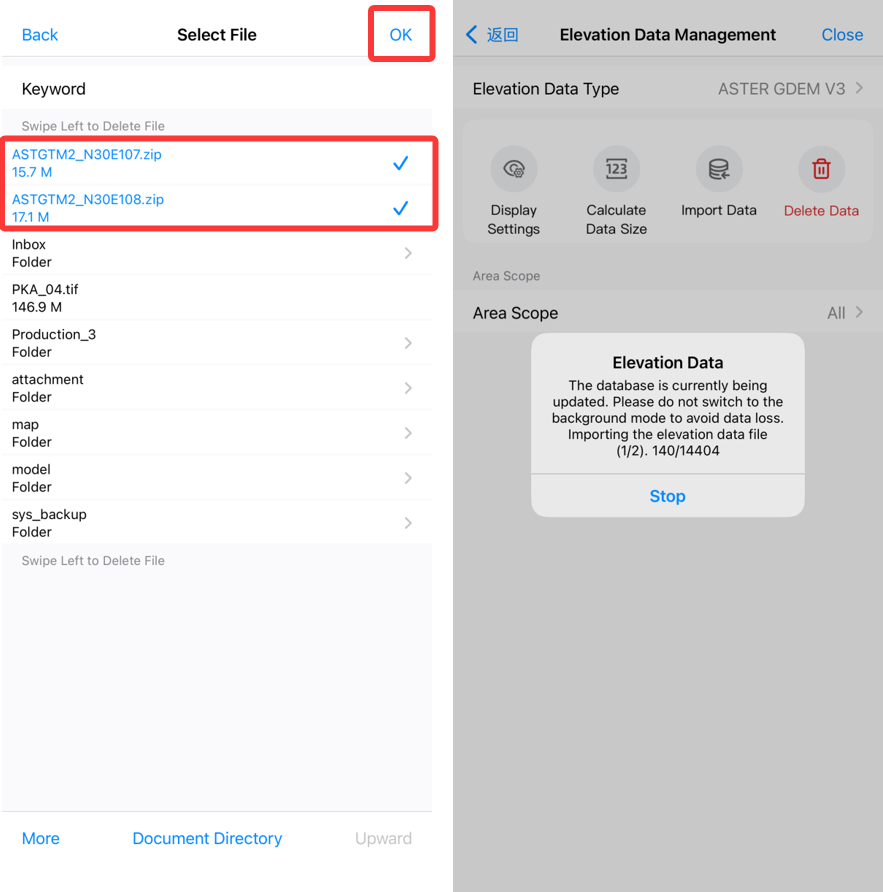
Select the elevation data file to be imported. You can select multiple files at a time. Then, tap [Open]. The selected files are imported into QubiMap.

image-20260609110004453

3) View contour lines

After importing the elevation data, you can view the contour lines in QubiMap.

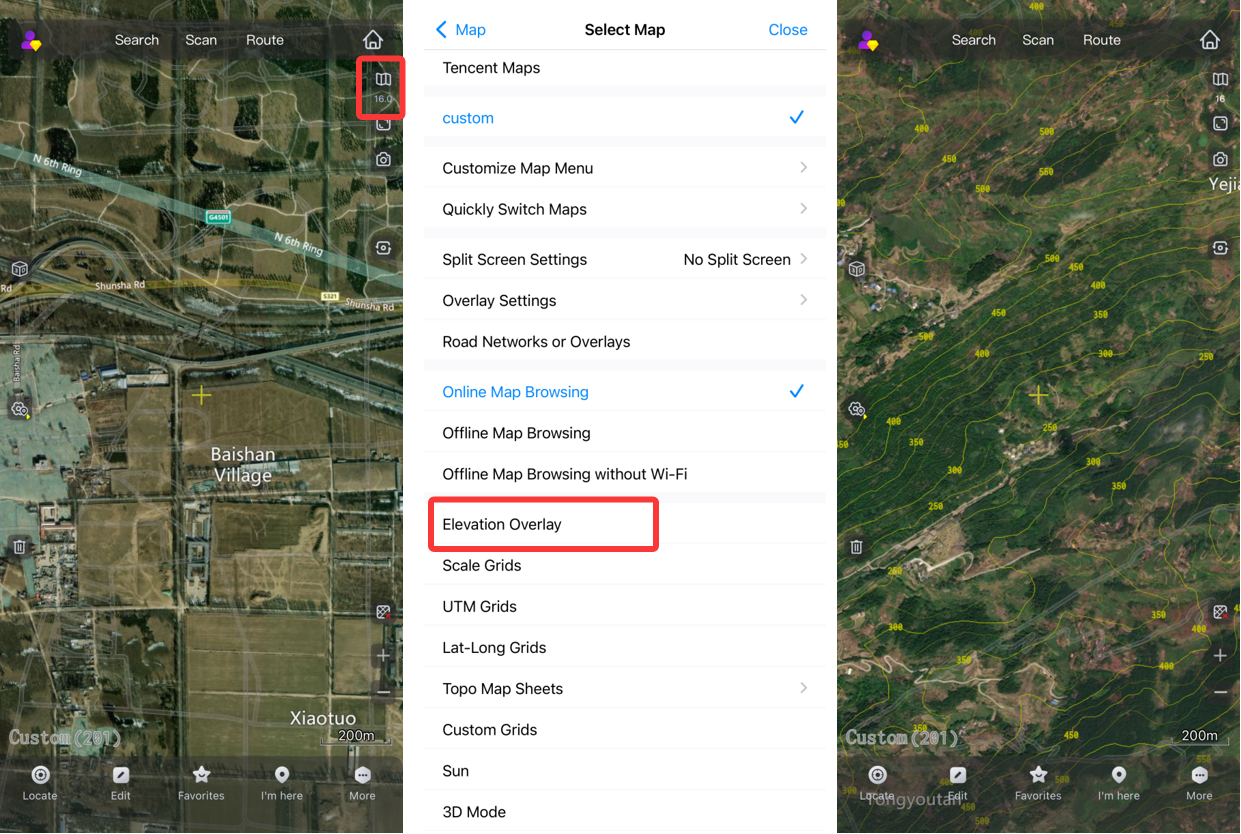
Go back to the main UI. Tap the 图片1 button, and select [Elevation Overlay].

Set the map zoom level to 12 or higher to show the contour lines.

image-20260609110210795

QubiMap provides custom icons to vividly demonstrate placemarks. This article describes how to add and use custom placemark icons on the PC and mobile versions.

1. PC

1) Add a custom icon

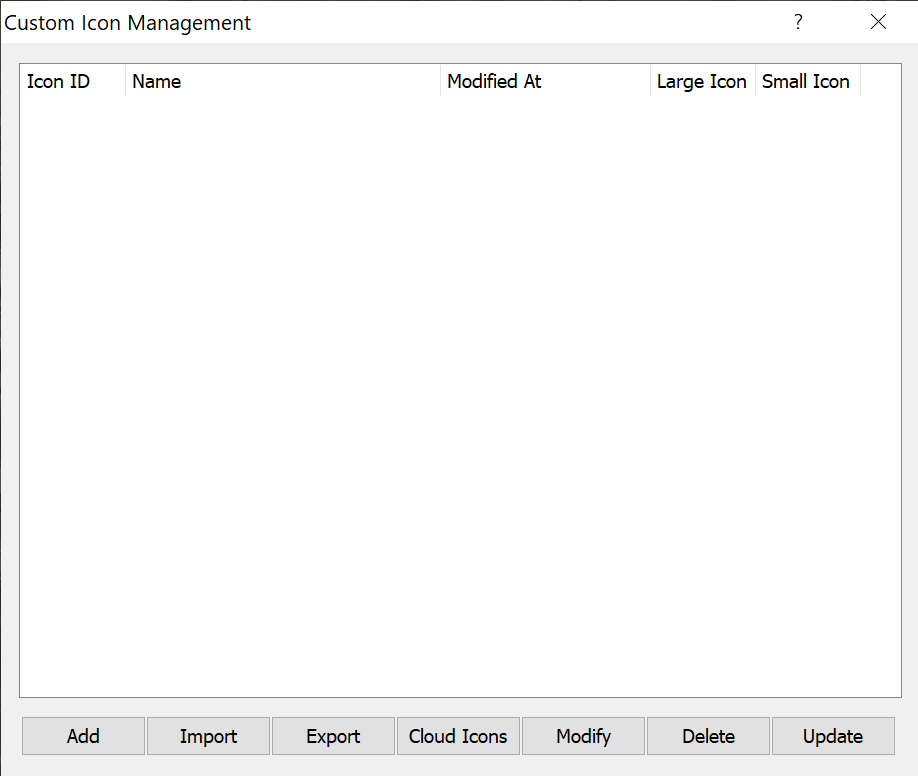
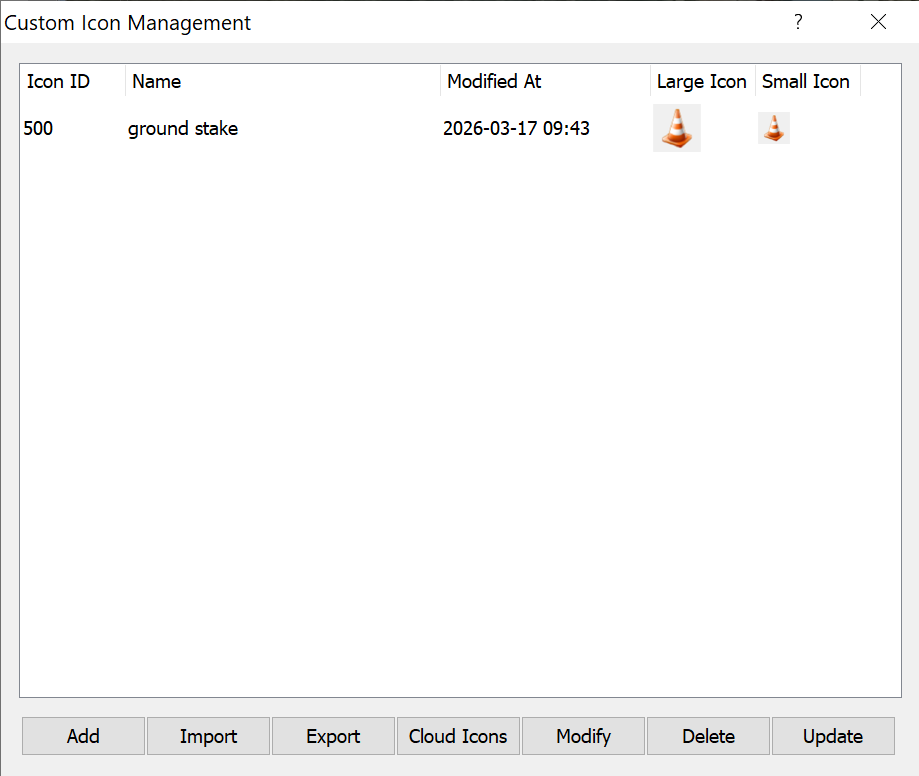
a. Choose [System] > [Data Management] > [Custom Icon Management] (or click [Manage Custom Icons] in the [Select Placemark Image — Custom] dialog box when you are setting the icon for a placemark) to go to the [Custom Icon Management] dialog box, as shown in the following figure:

image-20260316171655555

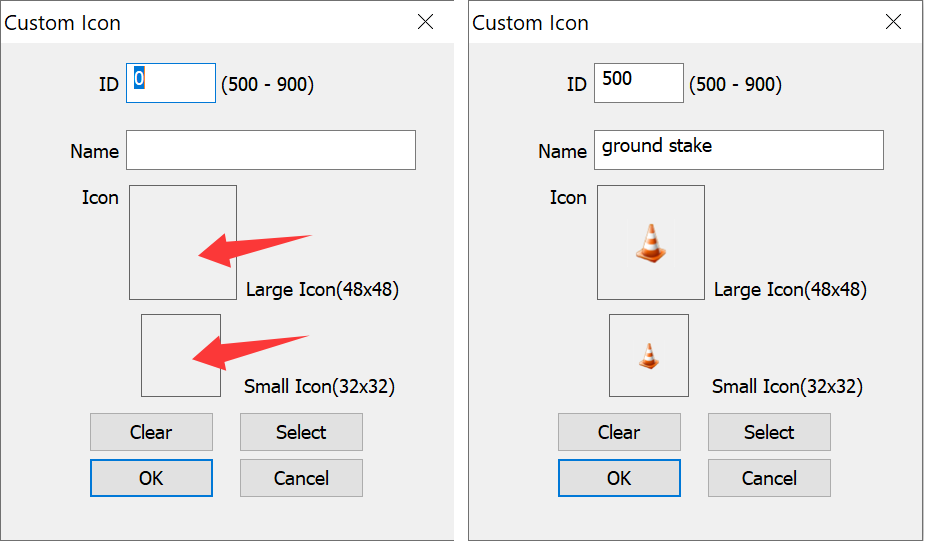
b. Click [Add]. In the following [Custom Icon] dialog box, set the required parameters:

66ba副本

Note: If you want to clone the existing icons, click [Select].

c. Enter the icon ID and icon name, click the icon box to select an image from your local disk (preferably a square PNG image), and then click [OK] to save. The saved icon appears in the [Custom Icon Management] list, as shown in the following figure:

image-20260317095138966

2) Other operations:

Import: Import the existing custom placemark icon files with the .ovimg extension from the local disk.

Export: Export the selected custom placemark icons (all content is exported if no items are selected) as the .ovimg file to the local disk.

Cloud Icons: Purchase, create, modify, and update cloud icons. For more details, see the related document at Help.

Modify: Modify the selected custom placemark icon.

Delete: Delete the selected one or more custom placemark icons.

2. Mobile device

1) Add a custom icon

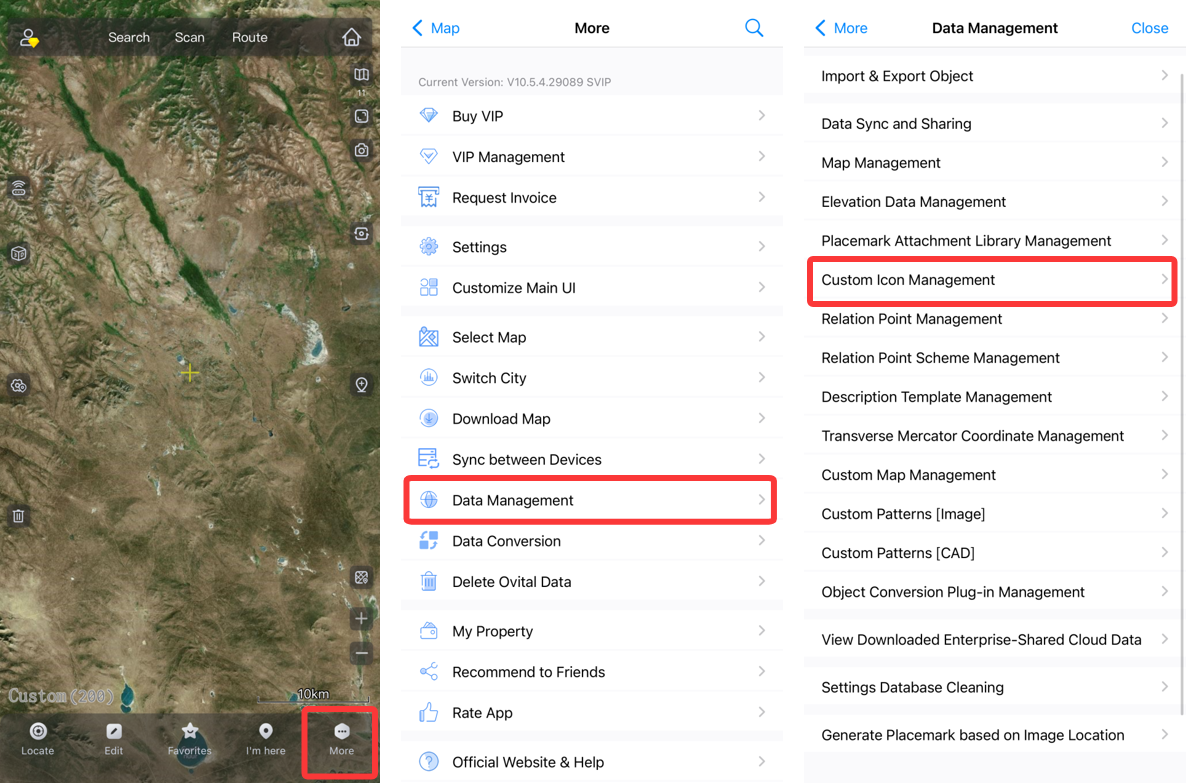
a. Choose [More] > [Data Management] > [Custom Icon Management] (or tap [Manage Custom Icons] in the placemark icon selection page when you are setting the icon for a placemark) to go to the [Custom Icon Management] page.

image-20260508155501036

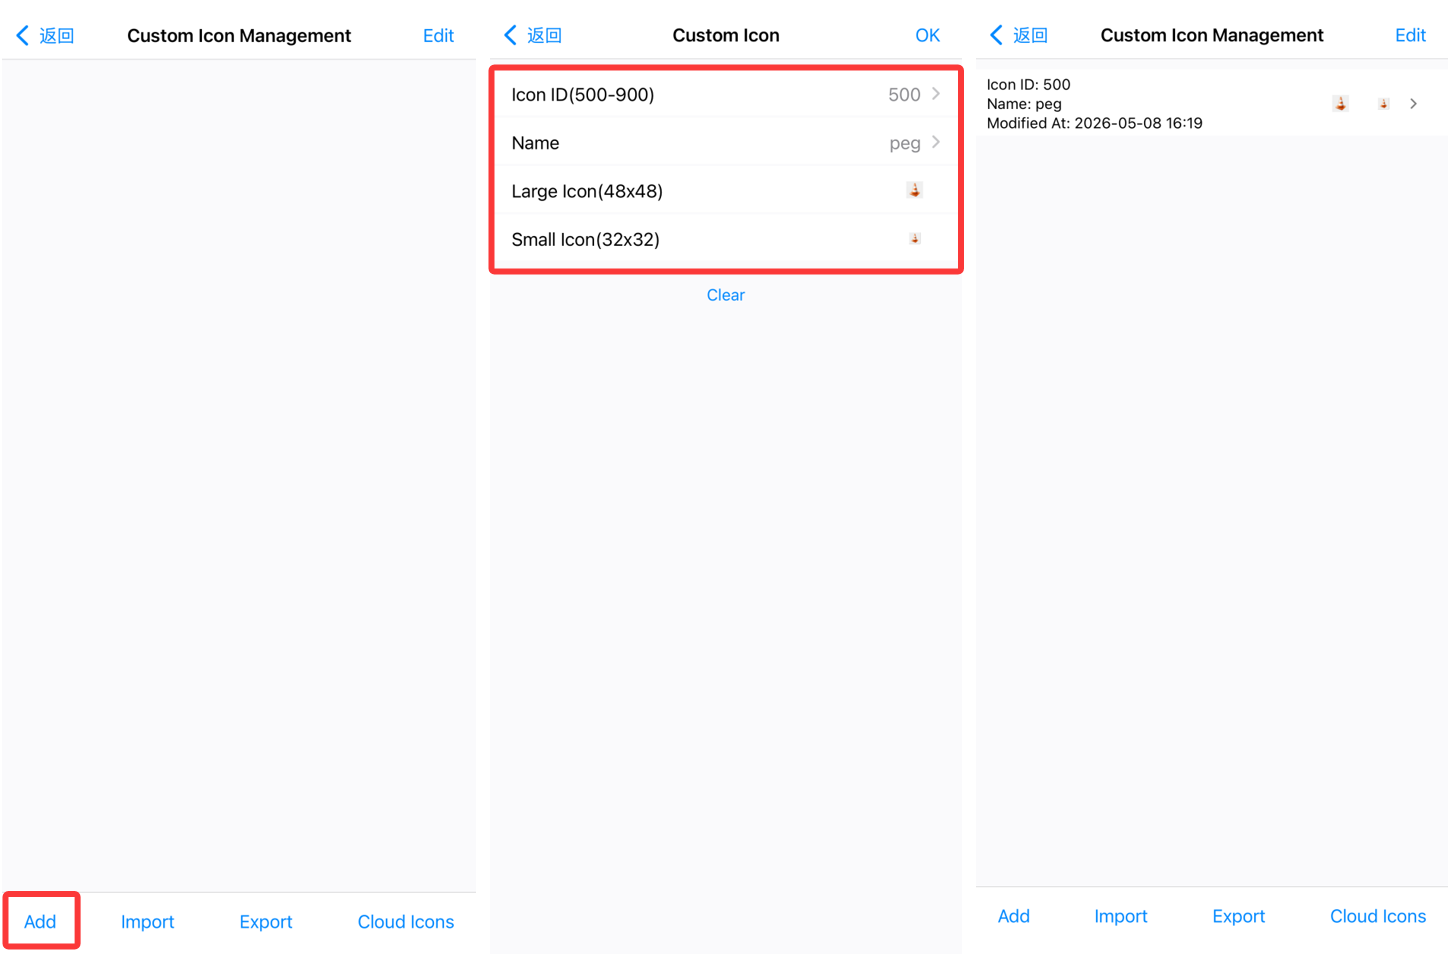
b. Tap [Add] to go to the [Custom Icon] page.

C. Enter the icon ID and icon name, click the icon box to select an image from your local disk (preferably a square PNG image), and then tap [OK] to save. The saved icon is displayed in the [Custom Icon Management] list.

image-20260508162549869

2) Other operations:

Import: Import the existing custom placemark icon files with the .ovimg extension from the local disk.

Export: Export the selected custom placemark icons (all content is exported if no items are selected) as the .ovimg file to the local disk. For example, the default destination directory for Android devices is Android/data/com.ovital.ovitalMap/files/omap.

Cloud Icons: Purchase, create, modify, and update cloud icons. For more details, see the related document at Help.

Modify: Modify the selected custom placemark icon.

Delete: Delete the selected one or more custom placemark icons.

In QubiMap, you can view the altitude of a single placemark, or retrieve the altitudes of multiple placemarks at the same time. The retrieved altitude information can be exported to a TXT or Excel file.

Before you retrieve placemark altitudes, make sure that the elevation data has been imported to QubiMap. For more information, see the help document “How to import elevation data”.

The procedure is described as follows:

1.Retrieve the altitudes of multiple placemarks

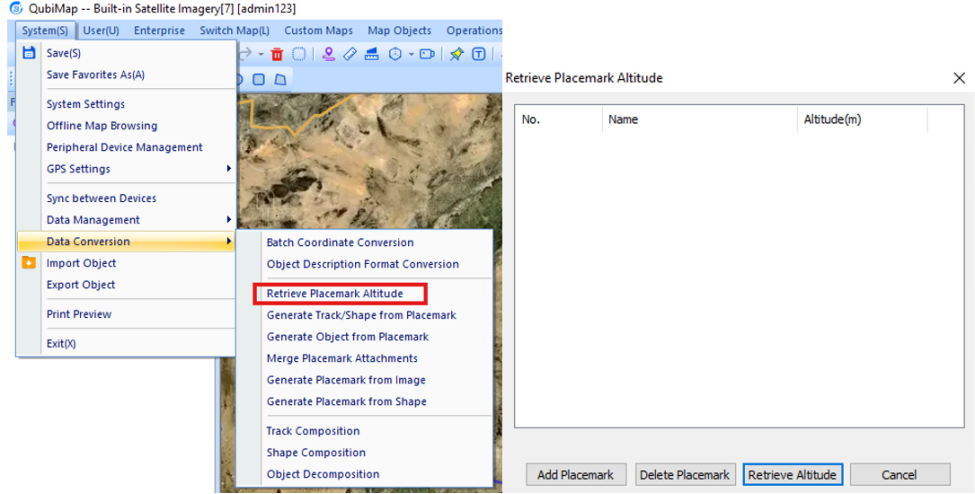
On the main UI, choose [System] > [Data Conversion] > [Retrieve Placemark Altitude].

image-20260710152617295

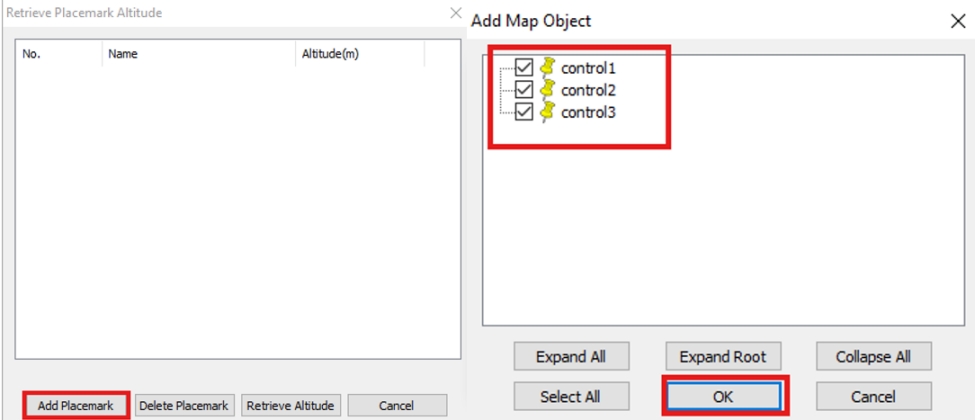
In the [Retrieve Placemark Altitude] dialog box, click [Add Placemark]. Select the required placemarks, and click [OK].

img

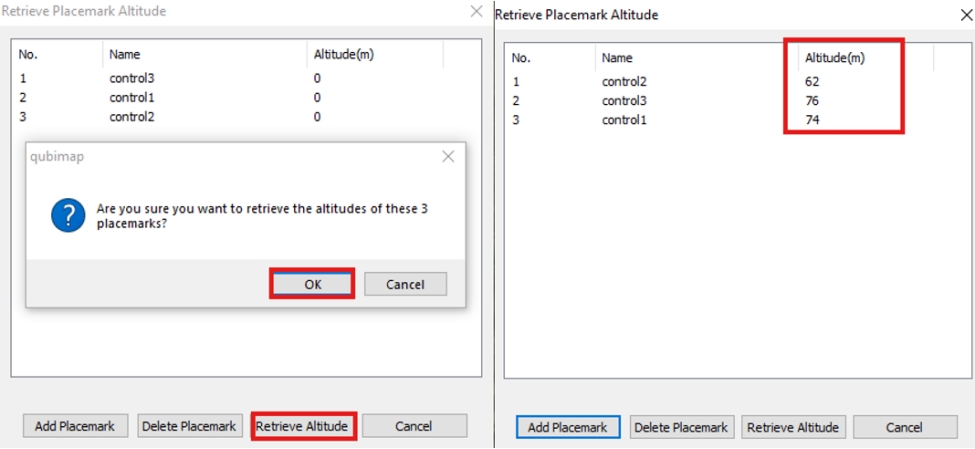
Click [Retrieve Altitude]. In the message that appears, click [OK].

img

2.View the altitude of a single placemark

1)PC

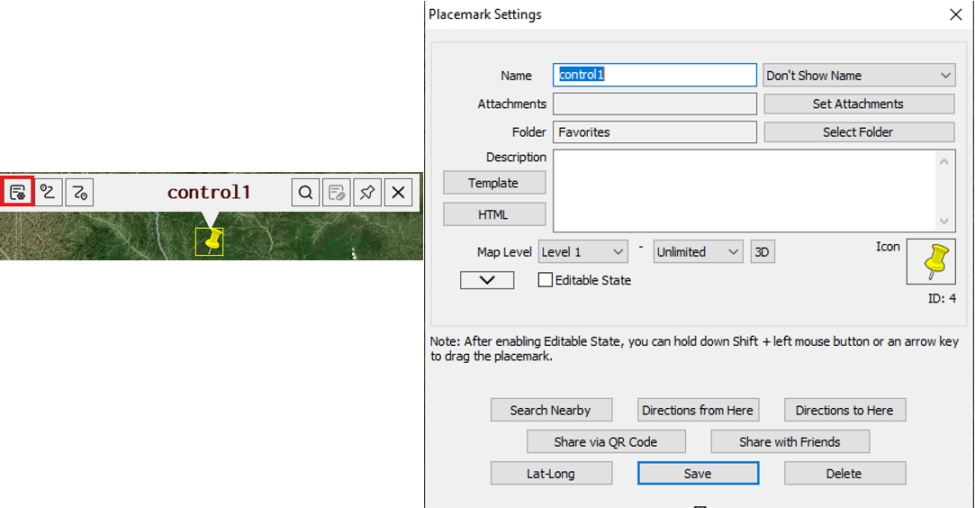
Find the required placemark on the map, click it, and then click the settings icon.

img

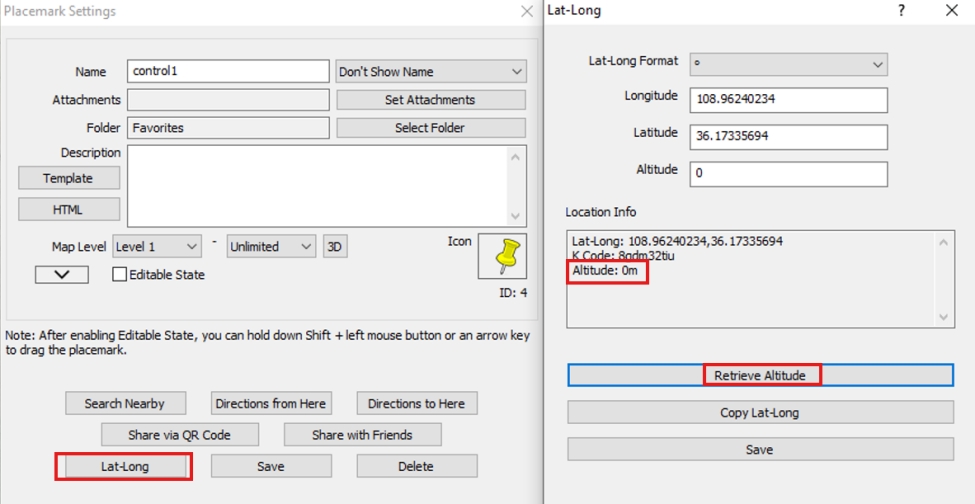
In the [Placemark Settings] dialog box, click [Lat-Long] to view the latitude and longitude of the placemark. In the [Lat-Long] dialog box, click [Retrieve Altitude] to view the altitude of the placemark.

img

2)Mobile device

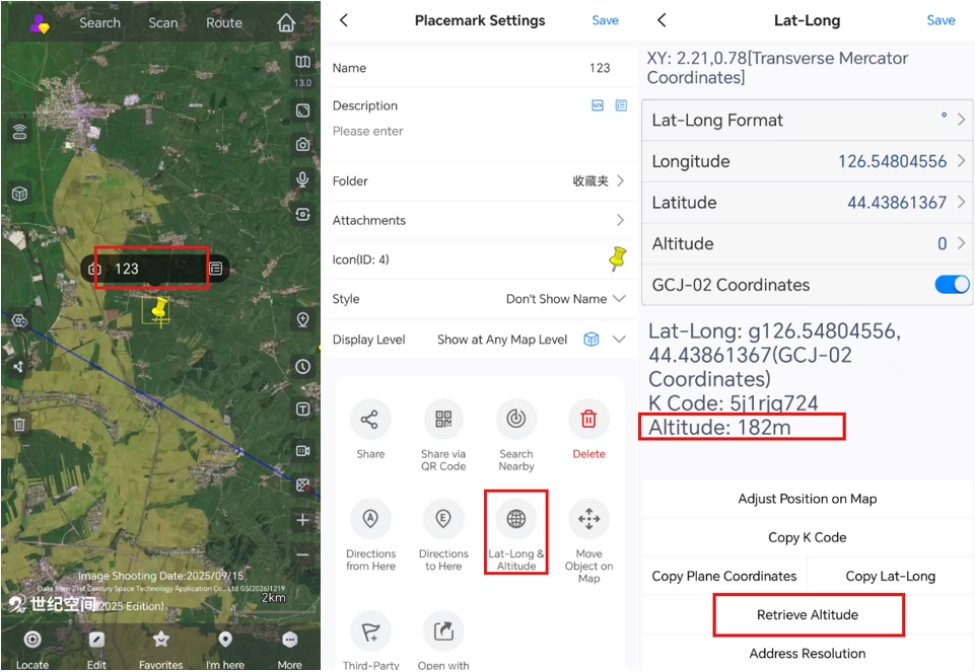
Find the required placemark on the map, tap the placemark, and then tap the displayed placemark name. On the [Placemark Settings] page, tap [Lat-Long & Altitude]. On the [Lat-Long] page, tap [Retrieve Altitude] to view the altitude of the placemark.

img

Both icon association and attachment association are used to associate QubiMap objects with third-party application interfaces. For icon association, placemark description is used as input and output items of third-party applications, while for attachment association, attachments are used only as input items. Placemark description can be at most 30KB in size and must be in text format. Attachments, however, have no limits in size and format; they can be text or large video files. Icon association supports third-party application output (that is, writing content back into placemark description), while no output is generated for attachment association. Furthermore, description is part of the placemark information, while attachments are the associated items of placemarks. The placemark information only includes the attachment number and not the content itself. Therefore, when you sync placemark data or share placemark data with your friends, the placemark description is already included, while the attachments must be processed separately.

Get ready to try QubiMap

Sign up for free trail and get started with QubiMap

Try Now